10X Trading System10X Trading System (Non Repaint)
TradingView Account Needed: Free
Not satisfied with your trading results so far? This may help:
The 10X Trading System helps you identify tops, bottoms and market direction — quickly and accurately.
The strategy behind its accuracy is the fact that it combines price action and multiple market timing algorithms to determine these significant turning points in the markets.
That way, you can be sure you have the best chance to get the best entry and exit points with perfect timing, and hopefully extract more profits from the markets than anybody else.
Once the 10X Trading system has spotted a possible top or bottom, it clearly displays these Buy or Sell alerts on your charts… showing you exactly where this may occur.
You can activate alerts to never miss a signal.
How to use the signals and alerts:
10X Trading System automatically analyze price action and multiple market timing algorithms to give you a signal when there's a good trade.
Works on all markets on all time frames so it's suitable for binary, scalping, day and swing trading.
10X Trading System allow you to get the best entry and exit points with perfect timing.
If you want more details, the link is in the signature.
Disclaimer:
Past performance is not indicative of future performance. No representation is being made that any results discussed within the service and its related media content will be achieved. All opinions, news, research, analyses, prices or other information is provided as general market commentary and not as investment advice. TradingWalk, their members, shareholders, employees, agents, representatives and resellers do not warrant the completeness, accuracy or timeliness of the information supplied, and they shall not be liable for any loss or damages, consequential or otherwise, which may arise from the use or reliance of the TradingWalk service and its content. © 2019 TradingWalk.
TradingWalk indicators are built for TradingView. TradingWalk is on no way a part of TradingView.
Поиск скриптов по запросу "swing trading"
Beast Mode PRO v4.0# Beast Mode PRO v4.0 - Advanced Multi-Regime Trading System
## Overview
Beast Mode PRO v4.0 is a sophisticated technical analysis indicator designed for active traders seeking high-probability setups across multiple timeframes. This system combines machine learning-inspired clustering algorithms with traditional technical analysis to identify market regimes and generate precision entry signals. The indicator adapts to different trading styles through intelligent preset configurations and multiple trading modes.
---
## Core Methodology
### Signal Generation Framework
The indicator employs a **multi-component voting system** that analyzes market conditions through several independent technical perspectives:
**Technical Components:**
- **RSI (Relative Strength Index)**: Momentum oscillator measuring overbought/oversold conditions
- **Fisher Transform**: Price transformation technique that normalizes price distributions for clearer turning points
- **DMI (Directional Movement Index)**: Trend strength indicator measuring directional pressure
- **Z-Score Analysis**: Statistical measure identifying price deviations from historical norms
- **Moving Average Ratio**: Price relationship to its moving average baseline
- **MFI (Money Flow Index)**: Volume-weighted momentum indicator
- **Stochastic Oscillator**: Momentum indicator comparing closing price to price range
- **CCI (Commodity Channel Index)**: Measures current price level relative to average price level
### Clustering Engine
The system utilizes a **k-means inspired clustering algorithm** that categorizes each technical indicator's normalized values into distinct market regimes (bullish, bearish, neutral). This approach:
1. **Normalizes** all indicators using z-score transformation over a historical lookback window
2. **Clusters** normalized values using percentile-based thresholds
3. **Aggregates** individual votes into a composite score ranging from -100 to +100
4. **Smooths** the composite score using selectable methods (SMA, EMA, WMA, HMA, TEMA, DEMA)
The clustering percentiles adapt dynamically based on current market volatility (ATR-normalized), ensuring the system remains responsive across different market conditions.
---
## Trading Modes
### 1. Normal Mode
Standard crossover-based signals using fixed thresholds (+10/-10). Suitable for balanced trading with moderate signal frequency.
### 2. Scalper Mode
Dynamic threshold adjustment based on recent score volatility. Generates more frequent signals by adapting to short-term price movements.
### 3. Aggressive Mode
Reversal-focused approach that triggers signals when the composite score crosses extreme levels (+80/-80), targeting major trend reversals.
### 4. Hybrid Mode
Combines Normal and Aggressive signals, capturing both standard crossovers and extreme reversals for comprehensive market coverage.
### 5. Super Scalper Mode
Ultra-responsive mode using signal line crossovers (14-period HMA of composite score) for maximum trade frequency.
### 6. Sniper Mode (Premium Feature)
Multi-confirmation system requiring alignment of:
- Composite score threshold breach
- Positive fast momentum (10-period SMI)
- Positive trend momentum (200-period SMI)
- Price above/below smart trend filter MA
This mode prioritizes precision over frequency, filtering out low-probability setups.
---
## Timeframe Presets
Pre-optimized configurations for common trading timeframes:
### 1 Minute Preset
- Fast smoothing (10-period WMA)
- Tight chop filter (61.8 threshold)
- Optimized for rapid scalping with minimal lag
### 2 Minute Preset
- Balanced smoothing (12-period EMA)
- Enhanced volume filtering
- Moderate cooling period (5 bars)
### 3 Minute Preset
- HMA smoothing for reduced lag
- Stochastic and CCI enabled
- Balanced approach for intraday trading
### 5 Minute Preset
- TEMA smoothing for trend following
- Stronger filters to reduce noise
- Extended lookback (1000 bars)
### 15 Minute Preset
- DEMA smoothing for swing positions
- Maximum filtering configuration
- All technical indicators enabled
- Suitable for swing trading and position building
Users can also select "Custom" to manually configure all parameters.
---
## Advanced Filtering System
### 1. Choppy Market Filter
Uses Choppiness Index calculation to identify consolidating markets. When CI exceeds the threshold, signals are suppressed to avoid whipsaw trades.
### 2. Smart Trend Filter
Configurable moving average (SMA/EMA/WMA/HMA/TEMA/DEMA/VWMA/RMA) that prevents counter-trend signals. Long signals require price above the MA, shorts require price below.
### 3. Volume Filter
Compares current volume to its moving average. Signals are suppressed when volume falls below the specified multiplier of average volume.
### 4. ATR Volatility Filter
Prevents trading during low volatility periods when ATR falls below its moving average multiplied by the specified factor.
### 5. Session Filter
Time-based filtering for Asia, London, New York, or combined sessions. Ensures trading only during preferred market hours.
### 6. Multi-Timeframe Confirmation
Optionally requires higher timeframe alignment before generating signals, adding confluence for higher probability trades.
### 7. Cooling Off Period
Prevents signal clustering by enforcing a minimum number of bars between consecutive signals.
---
## Smart Money Concepts Integration
### Order Block Detection
Identifies institutional supply/demand zones using multi-timeframe analysis:
- Detects strong directional candles followed by breakout moves
- Volume confirmation ensures significance
- Customizable timeframe selection (current TF or higher TF: 5m, 15m, 30m, 1H, Daily)
- Visual boxes mark active order blocks with automatic expiration after lookback period
- Price interaction alerts when touching active zones
### Liquidity Zones
Marks equal highs (EQH) and equal lows (EQL) where stop losses typically cluster, indicating potential reversal or breakout points.
---
## Momentum Analysis
### Fast Momentum (Default: 10-period)
Short-term momentum oscillator using Stochastic Momentum Index (SMI) calculation. Provides early warning of momentum shifts.
### Trend Momentum (Default: 200-period)
Long-term momentum gauge confirming overall trend direction. Used in Sniper Mode for multi-confirmation.
### Momentum Divergence Detection
Automatically identifies:
- **Regular Divergence**: Price makes new high/low but momentum doesn't (reversal signal)
- **Hidden Divergence**: Price makes higher low/lower high but momentum doesn't (continuation signal)
---
## Visual Components
### Price Chart Overlay
- **Smart Trend MA**: Dynamically colored moving average based on price position
- **EMA Cloud**: 50/200 EMA cloud showing long-term trend (background shading)
- **Trend Background**: Subtle background coloring based on composite score
- **Order Block Boxes**: Institutional supply/demand zones
- **Entry/Exit Markers**: Clear visual signals with emoji labels
- **Liquidity Markers**: EQH/EQL identification
### Bar Coloring
Bars change color based on active mode and market regime:
- **Sniper Mode**: Purple (bull) / Pink (bear)
- **Aggressive Mode**: Bright Green / Bright Red
- **Super Scalper**: Neon Green / Neon Red
- **Timeframe Presets**: Unique color schemes per preset
- **Choppy/Neutral**: Always gray regardless of mode
### Oscillator Pane
- **Composite Score Line**: Gradient-colored stepline showing current regime strength
- **Fast/Trend Momentum**: Optional overlays (gold/cyan colors)
- **Divergence Markers**: Visual alerts for regular, hidden, and momentum divergences
- **Power Zones**: Overbought/oversold regions (80/-80 levels)
- **Dynamic/Fixed Thresholds**: Visual reference lines based on active mode
### Interactive Dashboards
**Main Dashboard** displays:
- Active preset/mode configuration
- Real-time indicator values and votes
- Current market status (active/choppy/counter-trend/low volume/low ATR/MTF misalignment)
- Regime classification (Strong Long/Long/Neutral/Short/Strong Short)
- Smart Trend MA status
**Performance Dashboard** shows:
- Exit strategy (Fixed TP/SL, Trailing Stop, Opposite Signal)
- Total trades and win rate
- Total points and average per NY session
- Profit factor and recovery factor
- Best/worst trades and max drawdown
- Maximum winning/losing streaks
- Sharpe ratio and average risk:reward
**TP Optimizer** (33 variations tested):
- Tests take profit levels from 40 to 200 ticks (5-tick increments)
- Sortable by: Profit Factor, Win Rate, Total Points, Sharpe Ratio
- Displays top 5 configurations with full metrics
- Real-time optimization during backtesting
---
## Backtest Engine
### Exit Strategies
**1. Fixed TP/SL**
- Configurable in Ticks, ATR multiples, or Percentage
- Precise risk management with predefined targets
**2. Exit on Opposite Signal**
- Closes position when counter-signal appears
- Adapts to changing market conditions
- Useful for trend-following approaches
**3. Trailing Stop**
- Dynamic stop loss that follows profitable moves
- Configurable trailing offset percentage
- Locks in profits while allowing trends to develop
### Risk Management
- Optional minimum risk:reward filter
- Prevents trades below specified R:R threshold
- Date range filtering for historical analysis
- Session-based performance tracking
### Performance Metrics
- Win rate, profit factor, Sharpe ratio
- Maximum drawdown and recovery factor
- Consecutive win/loss streaks
- Average win/loss analysis
- Gross profit vs gross loss breakdown
---
## Alert System
Comprehensive alert conditions for:
- Entry signals (Long/Short)
- Exit events (TP/SL/Opposite/Trailing)
- Trend signals (Strong bullish/bearish)
- Divergences (Regular/Hidden/Momentum)
- Order block detection and touches
- Multi-condition strong signals (all confirmations aligned)
---
## How to Use
### Quick Start
1. Select your preferred timeframe preset (1m, 2m, 3m, 5m, 15m, or Custom)
2. Choose a trading mode (Normal, Scalper, Aggressive, Hybrid, Super Scalper, or Sniper)
3. Configure session filter to match your trading hours
4. Enable desired filters (choppy, trend, volume, ATR, MTF)
5. Set your exit strategy and TP/SL levels
6. Monitor signals on price chart and oscillator pane
### Optimization Workflow
1. Enable "Run TP Optimizer" in backtest settings
2. Run backtest on historical data
3. Review Optimizer Dashboard for best TP levels
4. Sort by preferred metric (Profit Factor, Win Rate, Total Points, Sharpe)
5. Apply winning configuration to live trading
### Advanced Configuration
- Customize individual indicator lengths and enable/disable specific components
- Adjust clustering parameters (lookback window, percentiles, cluster count)
- Fine-tune smoothing methods and lengths
- Configure order block detection timeframe and sensitivity
- Set cooling off period to control signal frequency
---
## Unique Features
1. **Adaptive Clustering**: Volatility-adjusted percentiles ensure consistent performance across market conditions
2. **Multi-Mode Architecture**: Six distinct trading modes from conservative to ultra-aggressive
3. **Timeframe Intelligence**: Pre-optimized presets eliminate guesswork for common timeframes
4. **Smart Money Integration**: Order block detection and liquidity zone marking
5. **Comprehensive Backtesting**: Three exit strategies with 33-variation TP optimization
6. **Visual Clarity**: Mode-specific bar coloring and clean chart presentation
7. **Filter Stack**: Seven-layer filtering system prevents low-quality signals
8. **Real-Time Metrics**: Live performance tracking with advanced statistics
---
## Benefits
- **Reduced False Signals**: Multi-confirmation clustering approach filters noise
- **Adaptability**: Works across timeframes and market conditions through preset system
- **Transparency**: Open visualization of all component votes and filtering status
- **Risk Management**: Built-in TP/SL optimization and R:R filtering
- **Time Efficiency**: Preset configurations save hours of manual optimization
- **Educational Value**: Dashboard shows exactly why signals trigger or get filtered
- **Professional Tools**: Institutional concepts (order blocks, liquidity zones) accessible to retail traders
---
## Best Practices
- Use Sniper Mode for high-probability setups during volatile markets
- Enable choppy filter during consolidation periods
- Combine Smart Trend Filter with MTF confirmation for swing trades
- Run TP Optimizer monthly to adapt to changing market dynamics
- Monitor Sharpe Ratio in addition to win rate for risk-adjusted performance
- Use session filters to avoid low-liquidity hours
- Start with preset configurations before custom optimization
---
## Technical Requirements
- TradingView Premium/Pro/Pro+ for full feature access
- Minimum chart history: 500 bars (adjustable in clustering settings)
- Works on all instruments (stocks, forex, crypto, futures)
- Compatible with standard candles (Heikin Ashi optional but not recommended for backtesting)
---
## Disclaimer
This indicator is a technical analysis tool designed to assist trading decisions. It does not guarantee profits and should be used in conjunction with proper risk management, fundamental analysis, and personal trading experience. Past performance does not indicate future results. Users should thoroughly test the indicator on demo accounts before live trading.
---
**Version**: 4.0
**Language**: Pine Script v6
**Type**: Overlay Indicator with Oscillator Pane
**Calculation**: On bar close (default) or real-time (configurable)

Malama's Range BreakoutMalama's Range Breakout is a dynamic Pine Script v6 indicator designed to automatically detect periods of price consolidation (tight ranges) on any timeframe or market, visually highlight them with expandable boxes, and generate actionable signals for breakouts and wick-based reversals.
Key Features
Adaptive Consolidation Detection: Uses a volatility-adjusted threshold (ATR multiplier) over a user-defined lookback period to identify genuinely tight ranges, avoiding false detections in trending or high-volatility conditions.
Preset Profiles: Quickly switch between optimized settings for different trading styles:
Tight Ranges (Scalping): Short lookback, low threshold for frequent small-range setups.
Normal Ranges (Intraday): Balanced for day trading.
Swing Trading: Longer lookback for larger consolidations.
Options Selling (Chop): Very low threshold to capture extended sideways/choppy phases.
Custom: Full manual control.
Visual Elements: Draws semi-transparent boxes around detected ranges (with optional dashed midline), dynamically extending them until a valid breakout occurs. Limits historical boxes for clean charts.
Breakout Signals: Triggers buy/sell labels and alerts only on confirmed breakouts, optionally requiring a volume spike (above SMA threshold) for higher-probability momentum moves.
Wick Reversal Signals: Detects rejection wicks touching range boundaries (without closing outside), signaling potential fakeouts or early reversals. Optional next-bar confirmation (e.g., bearish candle after upper wick) reduces false signals.
Built-in Alerts: Separate alert conditions for range detection, bullish/bearish breakouts, and confirmed/unconfirmed wick reversals.
How It Works
The script continuously monitors the price range over the selected lookback period. When the range contracts below the ATR-based threshold, it initiates a consolidation box starting from the tightest point. The box expands with new highs/lows while price remains inside.
A true breakout closes outside the box (with optional volume confirmation) → ends the range and plots a directional signal.
Wicks probing boundaries without closing outside → flags potential rejection/reversal zones inside the range.
This combination helps traders anticipate volatility expansion after compression, while distinguishing strong momentum breakouts from traps/false breaks.
Why It's Useful
Unlike fixed-time Opening Range Breakout (ORB) tools or simple consolidation detectors, this indicator adapts to current market volatility (via ATR) and works across all timeframes—ideal for scalping tight intraday ranges, capturing swing consolidations, or identifying chop for premium-selling strategies. The volume filter and wick reversal detection add confluence, helping avoid low-conviction trades in ranging markets.
Usage Tips
Best on liquid assets (stocks, futures, forex, crypto).
Combine breakouts with trend filters (e.g., higher-timeframe EMA) for directional bias.
Use wick signals cautiously in strong trends—they shine in ranges or at key levels.
Test presets on your preferred timeframe; "Normal" is a solid default for most intraday work.
No repainting: All logic based on confirmed closes.

Trendlines & SR ZonesIt's a comprehensive indicator (Pine Script v6) that represents two powerful technical analysis tools: automatic trendline detection based on pivot points and volume delta analysis with support/resistance zone identification. This overlay indicator helps traders identify potential trend directions and key price levels where significant buying or selling pressure has occurred.
Features: =
1. Price Trendlines
The indicator automatically identifies and draws trendlines based on pivot points, creating dynamic support and resistance levels.
Key Components:
Pivot Detection: Uses configurable left and right bars to identify significant pivot highs and lows
Trendline Filtering: Only draws downward-sloping resistance trendlines and upward-sloping support trendlines
Zone Creation: Creates filled zones around trendlines based on average price volatility
Automatic Management: Maintains only the 3 most recent significant trendlines to avoid chart clutter
Customization Options:
Left/Right Bars for Pivot: Adjust sensitivity of pivot detection (default: 10 bars each side)
Extension Length: Control how far trendlines extend past the second pivot (default: 50 bars)
Average Body Periods: Set the lookback period for volatility calculation (default: 100)
Tolerance Multiplier: Adjust the width of the trendline zones (default: 1.0)
Color Customization: Separate colors for high (resistance) and low (support) trendlines and their fills
2. Volume Delta % Bars
The indicator analyzes volume distribution across price levels to identify significant supply and demand zones.
Key Components:
Volume Profile Analysis: Divides the price range into rows and calculates volume delta at each level
Delta Visualization: Displays horizontal bars showing the percentage difference between buying and selling volume
Zone Identification: Automatically identifies the most significant supply and demand zones
Visual Integration: Connects volume delta bars with corresponding support/resistance zones on the price chart
Customization Options:
Lookback Period: Set the number of bars to analyze for volume (default: 200)
Price Rows: Control the granularity of the volume analysis (default: 50 rows)
Delta Sections: Adjust the number of horizontal delta bars displayed (default: 20)
Panel Appearance: Customize width, position, and direction of the delta panel
Zone Settings: Control the number of supply/demand zones and their extension (default: 3 zones)
How It Works-
Trendline Logic:
The script continuously scans for pivot highs and lows based on the specified left and right bars
When a pivot is detected, it creates a horizontal line at that price level
The script then looks for the previous pivot of the same type (high or low)
It connects these pivots with a trendline, extending it based on the user-specified setting
A parallel line is created to form a zone, with the distance based on average price volatility
The script filters out invalid trendlines (upward-sloping resistance and downward-sloping support). Only the 3 most recent trendlines are maintained to prevent chart clutter
Volume Delta Logic:
The script divides the price range over the lookback period into the specified number of rows
For each bar in the lookback period, it categorizes volume as bullish (close > open) or bearish (close < open). This volume is assigned to the appropriate price level based on the HLC3 price.
The price levels are grouped into sections, and the net delta (bullish - bearish volume) is calculated for each Horizontal bars are drawn to represent these delta percentages.
The most significant positive and negative deltas are identified and displayed as support and resistance zones. These zones are extended to the left on the price chart and connected to the delta panel with dotted lines.
Ideal Timeframes:
The indicator is versatile and can be used across multiple timeframes, but it performs optimally on specific timeframes depending on your trading style:
For Day Trading:
Optimal Timeframes: 15-minute to 1-hour charts
Why: These timeframes provide a good balance between noise reduction and sufficient volume data. The volume delta analysis is particularly effective on these timeframes as it captures intraday accumulation/distribution patterns while the trendlines remain reliable enough for intraday trading decisions.
For Swing Trading:
Optimal Timeframes: 1-hour to 4-hour charts
Why: These timeframes offer the best combination of reliable trendline formation and meaningful volume analysis. The trendlines on these timeframes are less prone to whipsaws, while the volume delta analysis captures multi-day trading sessions and institutional activity.
For Position Trading:
Optimal Timeframes: Daily and weekly charts
Why: On these higher timeframes, trendlines become extremely reliable as they represent significant market structure points. The volume delta analysis reveals longer-term accumulation and distribution patterns that can define major support and resistance zones for weeks or months.
Timeframe-Specific Adjustments:
Lower Timeframes (1-15 minutes):
Reduce left/right bars for pivots (5-8 bars)
Decrease lookback period for volume delta (50-100 bars)
Increase tolerance multiplier (1.2-1.5) to account for higher volatility
Higher Timeframes (Daily+):
Increase left/right bars for pivots (15-20 bars)
Extend lookback period for volume delta (300-500 bars)
Consider increasing the number of price rows (70-100) for more detailed volume analysis
Usage Guidelines-
For Trendline Analysis:
Use the trendlines as dynamic support and resistance levels
Price reactions at these levels can indicate potential trend continuation or reversal points
The filled zones around trendlines represent areas of price volatility or uncertainty
Consider the slope of the trendline as an indication of trend strength
For Volume Delta Analysis:
The horizontal delta bars show where buying or selling pressure has been concentrated
Green bars indicate areas where buying volume exceeded selling volume (demand)
Red bars indicate areas where selling volume exceeded buying volume (supply)
The highlighted supply and demand zones on the price chart represent significant price levels
These zones can act as future support or resistance areas as price revisits them
Customization Tips:
Trendline Sensitivity: Decrease left/right bars values to detect more pivots (more sensitive) or increase them for fewer, more significant pivots
Zone Width: Adjust the tolerance multiplier to make trendline zones wider or narrower based on your trading style
Volume Analysis: Increase the lookback period for a longer-term volume profile or decrease it for more recent activity
Visual Clarity: Adjust colors and transparency settings to match your chart theme and preferences
Conclusion:
This indicator provides traders with a comprehensive view of both trend dynamics and volume-based support/resistance levels. With these two analytical approaches, the indicator offers valuable insights for identifying potential entry and exit points, trend strength, and key price levels where significant market activity has occurred. The extensive customization options allow traders to adapt the indicator to various trading styles and timeframes, with optimal performance on 15-minute to daily charts depending on their trading horizon.
Chart Attached: NSE HINDZINC, EoD 12/12/25
DISCLAIMER: This information is provided for educational purposes only and should not be considered financial, investment, or trading advice. Please do boost if you like it. Happy Trading.

Volume Crisis Created by Alphaomega18
🎯 What is the Crisis Detector Pro?
The Crisis Detector Pro is an advanced multi-component indicator that detects market crisis situations by simultaneously analyzing:
Volume: Anomalies and volume spikes
VIX: Volatility Index (S&P 500)
ATR: True volatility (all assets)
Open Interest: Estimated open interest (futures contracts)
The indicator calculates a Composite Crisis Score (0-100) that combines these elements to alert you to critical market moments.
📊 Indicator Components
1️⃣ Volume Analysis
Anomaly detection: Compares current volume to its moving average
Classification:
🟡 Moderate: 1.5x - 2x average
🟠 High: 2x - 3x average
🔴 Extreme: > 3x average
Bollinger Bands: Detects volume breakouts
Clusters: Identifies 3+ consecutive days of anomalies
2️⃣ VIX (Fear Index)
S&P 500 only
Default thresholds:
🟡 Moderate: VIX > 20
🟠 High: VIX > 30
🔴 Extreme: VIX > 40
3️⃣ ATR (Average True Range)
Measures true volatility
Compatible with all assets (stocks, futures, forex, crypto)
Compares current ATR to its average
4️⃣ Open Interest (OI)
Estimation based on Volume / 2
Detects changes > 25%
Inverted colors:
🔴 Red: OI increase (new positions)
🟢 Green: OI decrease (position closing)
⚙️ Main Parameters
Calculations:
Moving Average Period: 20 (default)
Standard Deviation Period: 20
ATR Period: 14
Volume Thresholds:
Moderate: 1.5x
High: 2.0x
Extreme: 3.0x
Composite Score (Weights):
Volume: 35%
VIX: 25%
ATR: 20%
Open Interest: 20%
📈 Visual Signals
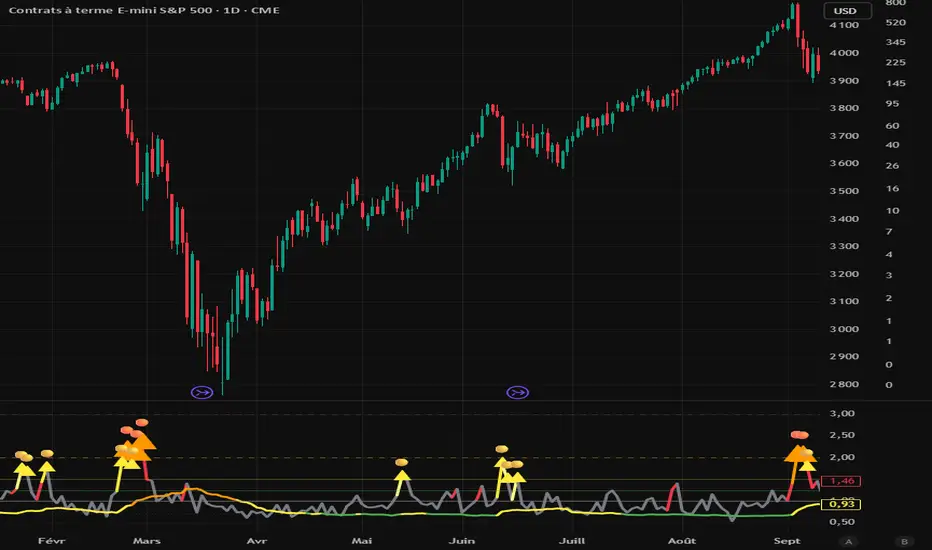
Top of Chart:
🟡 Yellow triangle: Moderate alert (Score 50-70)
🟠 Orange triangle: High alert (Score 70-85)
🔴 Red triangle: EXTREME CRISIS (Score 85-100)
⚠️ Purple cross: Reinforced signal (Volume + Volatility simultaneous)
Bottom of Chart:
💎 Purple diamond: 50-day volume record
⬛ Fuchsia square: Cluster (3+ abnormal days)
Volume Bars:
Gray: Normal volume
🟡 Yellow: Moderate volume
🟠 Orange: High volume
🔴 Red: Extreme volume
Open Interest Curve:
🔵 Blue: Normal variation
🔴 Red: Increase > 25%
🟢 Green: Decrease > 25%
🎯 How to Use the Indicator
1. Initial Setup
For S&P 500 / US Indices:
Enable VIX ✅
Enable ATR ✅
Enable OI ✅
Composite Score ✅
For Other Assets (Forex, Crypto, Stocks):
Disable VIX ❌
Enable ATR ✅
Enable OI (optional)
Composite Score ✅
2. Crisis Score Interpretation
ScoreLevelMeaningAction0-50Normal ✅Calm marketNormal trading50-70Vigilance 🟡Volatility risingIncreased monitoring70-85Danger 🟠Critical situationReduce exposure85-100Crisis 🔴MAXIMUM ALERTCapital protection
3. Trading Strategies
Directional Trading:
Reinforced signal ⚠️ = Powerful move in progress
Enter in direction of movement with confirmation
Tight stops, quick targets
Risk Management:
Score > 70 → Reduce position size by 50%
Score > 85 → Stop trading or ultra-short positions
Cluster detected → Avoid new trades
Scalping/Day Trading:
Extreme volume 🔴 = Scalping opportunities
Wait for confirmation before entering
Exit quickly on spikes
Swing Trading:
Avoid opening swings during crises
Protect existing positions (trailing stops)
Wait for return to normal (Score < 50)
4. Open Interest (Futures):
OI Increase (🔴 Red):
New positions opened
Strong market conviction
Movement may intensify
OI Decrease (🟢 Green):
Position closing
Profit-taking or stop losses
Possible reversal
🔔 Configurable Alerts
The indicator includes 8 types of alerts:
🟡 Moderate Crisis Alert: Score 50-70
🟠 HIGH Crisis ALERT: Score 70-85
🔴 MAJOR CRISIS: Score 85-100
⚠️ REINFORCED SIGNAL: Extreme Volume + Volatility simultaneous
💎 RECORD Volume: Highest volume over 50 days
📊 Cluster DETECTED: 3+ consecutive abnormal days
📈 OI SPIKE >25%: Sharp Open Interest increase
📉 OI DECLINE >25%: Sharp Open Interest decrease
Setup: Right-click on chart → "Add Alert" → Select alert
💡 Optimization Tips
Scalping (1-5min):
MA Period: 10-15
Moderate Threshold: 1.3x
High Threshold: 1.8x
Volume Weight: 50%
Day Trading (15min-1H):
MA Period: 20 (default)
Thresholds: Default
Composite Score: Enabled
Swing Trading (4H-Daily):
MA Period: 30-50
StdDev Multiplier: 2.5
ATR Period: 20
Volatile Markets (Crypto):
Moderate Threshold: 1.8x
High Threshold: 2.5x
Extreme Threshold: 4.0x
ATR Weight: 30%
📊 Statistics Table
The real-time table displays:
Crisis Score: 0-100 with color coding
Current volume: Value and ratio
Volume Score: Contribution to total score
Open Interest: Estimated value and % change
VIX: Current value (if enabled)
ATR: Ratio to average
Global STATUS: Normal ✅ / Vigilance 🟡 / Danger 🟠 / Crisis 🔴
⚠️ Warnings and Limitations
❌ Limitations:
Open Interest is estimated (Volume / 2), not real value
VIX only works for S&P 500
False signals possible in very volatile markets
✅ Best Practices:
Always combine with classic technical analysis
Never trade solely on alerts
Adapt thresholds to your asset and timeframe
Backtest before using live
Respect your risk management plan
🎓 Real Use Cases
Example 1: Flash Crash
Extreme volume 🔴 + Extreme ATR 🔴 + Reinforced signal ⚠️
Composite score > 90
Action: No new trades, protect existing positions
Example 2: Fed Announcement
VIX > 35 + Moderate volume 🟡 + OI rising 🔴
Composite score: 65
Action: Reduce position size, widen stops
Example 3: Volatility Squeeze
Cluster detected + Volume record 💎 + OI declining 🟢
Action: Scalping opportunity in breakout direction
📈 Performance
Real-time detection (0 lag)
Compatible all markets and timeframes
Low resource consumption
Complete history preserved

Institutional Dominance/Trapped Trader Profile @MaxMaserati 3.0📊 Institutional Dominance & Trapped Trader Delta Profile
@MaxMaserati 3.0
═════════════════════════════════════════════════════════════
🎯 OVERVIEW
The IDT Auction Profile is a professional-grade volume order flow analysis tool that reveals where institutional traders hold Positional Advantage and where retail participants are Trapped. Unlike traditional Volume Profile indicators, the IDT Profile integrates Volume Point Delta (VPD) analysis with advanced pattern recognition to identify the exact price levels where profitable institutional positions create support/resistance, and where losing positions are forced to exit.
This indicator answers the critical questions: Who is in profit? Who is trapped? And where will they defend or exit their positions?
═════════════════════════════════════════════════════════════
✨ FEATURES
═════════════════════════════════════════════════════════════
⚡ Quick Presets - One-click configuration for:
• Scalper (1m-5m): 75 bars, 50 rows, ★3 confluence
• Day Trader (15m-1h): 150 bars, 60 rows, ★3 confluence
• Swing Trader (4h-D): 300 bars, 80 rows, ★4 confluence
🔔 Price Alerts - Get notified when price touches:
• VAH (Value Area High) - Resistance zone
• VAL (Value Area Low) - Support zone
• Adjustable sensitivity (0.05% - 1.0%)
📏 POC Line Extensions - Historical context lines extending left from key institutional levels
👻 Previous Session POCs - Dotted reference lines showing prior period levels (carry-over zones)
📊 Real-Time Statistics Panel:
• Total Volume
• Net Delta
• Buy/Sell Pressure %
🎨 Visual Enhancements:
• Column dividers for clarity
• Transparency controls
• Profile auto-hide when price moves away
• Cached color schemes for 30% performance boost
═════════════════════════════════════════════════════════════
🧠 CORE CONCEPT: DOMINANCE VS TRAPPED POSITIONING
═════════════════════════════════════════════════════════════
The indicator categorizes all market participants into two strategic positions based on their entry price relative to current market price:
📍 ABOVE CURRENT PRICE (Resistance Zones)
🔴 Aggressive Sellers in Profit - Sold higher, currently winning. Will defend positions or add to winners.
🟥 Trapped Buyers at Loss - Bought higher, currently losing. Must exit at breakeven, creating resistance.
📍 BELOW CURRENT PRICE (Support Zones)
🟢 Aggressive Buyers in Profit - Bought lower, currently winning. Will defend positions or add to winners.
🟩 Trapped Sellers at Loss - Sold lower, currently losing. Must cover at breakeven, creating support.
⚡ MAXIMUM CONFLUENCE ZONES
When Dominant (Profitable) and Trapped (Loss) positions align at the same level, you get the strongest support/resistance zones:
🟧 Orange Boxes (Above Price) = Aggressive Sellers + Trapped Buyers = STRONGEST RESISTANCE
🟨 Yellow Boxes (Below Price) = Aggressive Buyers + Trapped Sellers = STRONGEST SUPPORT
═════════════════════════════════════════════════════════════
📊 VOLUME ANALYSIS COLUMNS
═════════════════════════════════════════════════════════════
1️⃣ VPD Column (Volume Point Delta)
Net aggressive pressure at each price level (Buying Volume - Selling Volume)
- Bullish Delta (Green): Buyers dominated the auction at this level
- Bearish Delta (Red): Sellers dominated the auction at this level
- Smart Coloring: Automatically highlights institutional patterns
2️⃣ VPS Column (Volume Point of Sell - ASK Volume)
Aggressive buying volume that "lifted the offer" by hitting ask prices
- Represents participants who paid the ask price to enter long
- When price is below this level = These buyers are in profit
- When price is above this level = These sellers who got hit are in profit
- Shows institutional bid volume absorption
3️⃣ VPB Column (Volume Point of Buy - BID Volume)
Aggressive selling volume that "hit the bid" by taking bid prices
- Represents participants who sold at bid price to enter short
- When price is above this level = These sellers are in profit
- When price is below this level = These buyers who got hit are in profit
- Shows institutional ask volume absorption
4️⃣ SVP Column (Optional - Session Volume Profile)
Traditional combined volume profile without bid/ask separation
═════════════════════════════════════════════════════════════
🔍 ADVANCED INSTITUTIONAL PATTERNS DETECTION
═════════════════════════════════════════════════════════════
The indicator uses statistical analysis (standard deviation, moving averages, hit counting) to identify institutional footprints:
⚡ Failed Auctions - "BUYERS TRAPPED" or "SELLERS TRAPPED" labels
• High volume entered, but price immediately reversed
• Creates extreme concentrations of losing positions
• Trading Implication: High-probability reversal zones where trapped participants must exit
📈 Volume Spikes - Bright green/red bars in VPD column
• Volume exceeds average by 2+ standard deviations
• Represents aggressive institutional entry
• Trading Implication: Potential trend continuation or setup for failed auction
🛡️ Absorption Zones - Yellow/Orange colored bars
• Large passive orders absorbing aggressive volume without price movement
• Indicates accumulation (bullish) or distribution (bearish)
• Trading Implication: Institutional positioning before major moves
🧊 Iceberg Orders - Cyan colored bars with high hit counts
• Same price level shows repeated volume without clearing
• Reveals hidden institutional limit orders split into small pieces
• Trading Implication: Strong liquidity magnets, price often returns here
💜 Volume Exhaustion - Purple colored bars
• Sharp volume drop (50%+) after spike
• Momentum exhausted, participants depleted
• Trading Implication: Potential reversal or consolidation ahead
═════════════════════════════════════════════════════════════
🎨 SMART INSTITUTIONAL COLORING
═════════════════════════════════════════════════════════════
Colors bars based on detected patterns vs simple red/green:
🟨 Yellow = Bullish battles won (buyers + trapped sellers)
🟧 Orange = Bearish battles won (sellers + trapped buyers)
🔵 Cyan = Iceberg orders (hidden liquidity)
🟣 Purple = Large passive orders
🟢 Bright Green = Buying spikes (institutional aggression)
🔴 Bright Red = Selling spikes (institutional aggression)
═════════════════════════════════════════════════════════════
⭐ CONFLUENCE SCORING SYSTEM
═════════════════════════════════════════════════════════════
Each price level receives 1-5 stars based on:
★★ Volume spike presence (+2 stars)
★ Absorption pattern (+1 star)
★ Large passive orders (+1 star)
★ Proximity to Value Area (+1 star)
★★ Iceberg detection (+2 stars)
★★ Failed auction (+2 stars)
Minimum Signal Strength filter lets you show only levels with ★3+ confluence for highest-quality signals.
═════════════════════════════════════════════════════════════
🎯 VALUE AREA ANALYSIS
═════════════════════════════════════════════════════════════
VAH (Value Area High) - Blue Line
- Top of the 70% volume acceptance zone
- Price at VAH often rejects downward (resistance)
- Alert triggers when price approaches
VAL (Value Area Low) - Red Line
- Bottom of the 70% volume acceptance zone
- Price at VAL often bounces upward (support)
- Alert triggers when price approaches
Trading Applications:
- Price outside Value Area → Mean reversion opportunity
- Price breaks VA with volume → Trend continuation
- Price oscillates within VA → Range-bound, fade extremes
- Previous session VA lines show carryover levels
═════════════════════════════════════════════════════════════
📋 EXPECTED PRICE BEHAVIOR AT KEY LEVELS
═════════════════════════════════════════════════════════════
⚠️ IMPORTANT: These are observed behavioral patterns for educational purposes and backtesting research. Always validate with 250-500+ backtest trades before risking capital.
1️⃣ POC BOX ZONES (Highest Statistical Relevance)
🟨 Yellow Boxes (Below Current Price - SUPPORT)
Expected Behavior:
- Price approaching from above typically encounters buying pressure
- Both profitable institutional buyers and trapped short sellers create demand
- Common reaction: Price slows, consolidates, or bounces
- Failed bounces often lead to rapid breakdown (trapped buyers capitulate)
What Often Happens:
- Initial dip into zone → Weak bounce attempt
- Second test → Stronger bounce (trapped sellers covering + buyers defending)
- Break below → Quick acceleration as both groups exit
🟧 Orange Boxes (Above Current Price - RESISTANCE)
Expected Behavior:
- Price rallying into zone typically encounters selling pressure
- Both profitable institutional sellers and trapped long buyers create supply
- Common reaction: Price stalls, consolidates, or rejects
What Often Happens:
- Initial push into zone → Weak rejection
- Second test → Stronger rejection (trapped buyers exiting + sellers defending)
- Break above → Quick acceleration as resistance becomes support
2️⃣ FAILED AUCTION ZONES
"SELLERS TRAPPED" Labels (Below Price):
- High-volume selling that immediately reversed = maximum trapped shorts
- When price returns, trapped sellers face pressure to cover
- Typical pattern: Price approaches → Initial hesitation → Sharp bounce
"BUYERS TRAPPED" Labels (Above Price):
- High-volume buying that immediately failed = maximum trapped longs
- Price returning forces trapped buyers to exit at breakeven
- Typical pattern: Price approaches → Distribution → Rejection
3️⃣ VALUE AREA DYNAMICS
Price Outside Value Area (VAH/VAL):
- Price beyond 70% volume zone = statistical outlier
- Two outcomes: Mean reversion OR trend continuation
- Key differentiator: Presence of confluence zones
Mean Reversion Pattern (No Strong Confluence):
- Price extends 1-2% beyond VA → Typically reverts toward POC
- Weak volume on extension → Higher probability of reversal
Breakout Pattern (With ★4+ Confluence):
- Price breaks VA with institutional patterns → Often continues
- Strong volume + confluence = New value area forming
4️⃣ ICEBERG ORDER BEHAVIOR
Cyan Bars with High Hit Counts:
- Repeated volume at same level = Large hidden order absorbing
- Price typically "tests" iceberg multiple times before resolution
- Two outcomes: Absorption complete (break) OR rejection (bounce)
5️⃣ VOLUME SPIKE PATTERNS
Bright Green/Red Bars (Institutional Aggression):
- Extreme delta spikes indicate institutional entry
- Trend Continuation Spikes: Spike aligned with trend = Often continues
- Exhaustion Spikes: Spike against trend = Failed auction forming
═════════════════════════════════════════════════════════════
⚙️ CONFIGURATION GUIDE
═════════════════════════════════════════════════════════════
🎯 QUICK START
1. Select your trading style preset (Scalper/Day/Swing)
2. Enable VAH/VAL alerts in settings
3. Adjust alert sensitivity (0.1% recommended)
4. Add alert condition to TradingView alert system
📊 CORE SETTINGS
- Lookback Period: How many bars to analyze
- Scalping: 50-100 bars
- Day Trading: 100-200 bars
- Swing Trading: 200-500 bars
- Price Row Granularity: How finely to divide price
- 40-50 rows = Fast markets
- 60-80 rows = Balanced (RECOMMENDED)
- 100+ rows = Maximum precision
- Minimum Signal Strength: Filter weak signals
- ★3 = Balanced quality/quantity (RECOMMENDED)
- ★4-5 = Highest quality, fewer opportunities
🎨 VISUAL SETTINGS
- Color Theme: Classic/Institutional/Monochrome/Bold/Minimal/Custom
- Smart Coloring: ON (recommended) - Shows institutional patterns
- Transparency: Adjust profile opacity
- Column Dividers: Visual separators between columns
- POC Extensions: Show historical level significance
📈 ADVANCED FEATURES
- Auto-Hide Distance: Hide profile when price moves X% away
- Statistics Panel: Real-time metrics display
- Previous POCs: Show prior session levels
- Alert Sensitivity: How close price must be to trigger alerts
═════════════════════════════════════════════════════════════
💡 BEST PRACTICES
═════════════════════════════════════════════════════════════
✅ Start with defaults (200 lookback, 60 rows, ★3 confluence, Smart Coloring ON)
✅ Focus on POC boxes first - These are your highest-probability zones
✅ Combine with price action - Use the profile to explain WHY support/resistance exists
✅ Watch for alignment - Yellow/Orange boxes = strongest levels
✅ Respect failed auctions - "TRAPPED" labels are extreme reversal setups
✅ Use Value Area for context - Price outside VA = mean reversion opportunity
✅ Trust confluence scores - ★4-5 signals are institutional-grade setups
✅ Set up alerts for VAH/VAL touches - Don't miss key levels
✅ Check previous session POCs - Institutions defend same zones across sessions
✅ Monitor statistics panel - Understand market conviction in real-time
═════════════════════════════════════════════════════════════
🔧 TECHNICAL SPECIFICATIONS
═════════════════════════════════════════════════════════════
Calculation Method: Enhanced delta using OHLC and volume with wick ratio analysis
Update Frequency: Real-time on every bar close
Performance: Optimized with color caching and pre-calculated values (~30% faster)
Max Capacity: Supports up to 1500 bars lookback and 250 price rows
Compatibility: Works on all symbols and timeframes
Memory Usage: Efficient array management with proper initialization
Alert System: Built-in VAH/VAL touch detection with visual markers
═════════════════════════════════════════════════════════════
🎯 UNIQUE VALUE PROPOSITION
═════════════════════════════════════════════════════════════
Unlike standard Volume Profile indicators that only show where volume occurred, the IDT Auction Profile:
✅ Separates bid vs ask volume to reveal true order flow
✅ Identifies who is profitable vs who is trapped at each level
✅ Detects institutional patterns (icebergs, absorption, failed auctions)
✅ Calculates confluence scores combining multiple factors
✅ Provides clear POC boxes showing exact institutional positioning
✅ Maps positional advantage rather than just volume density
✅ Alerts you to key level touches in real-time
✅ Shows historical context with POC extensions
✅ Displays live statistics for market conviction
This transforms Volume Profile from a historical volume chart into a strategic positioning map showing institutional dominance and trapped participants.
═════════════════════════════════════════════════════════════
📖 HOW TO INTEGRATE WITH YOUR STRATEGY
═════════════════════════════════════════════════════════════
✅ PROPER USES:
- Entry refinement within your existing setups
- Intelligent stop placement beyond institutional levels
- Objective profit targets at next confluence zones
- Trade filtering (only take setups at ★4+ zones)
- Understanding market positioning before entry
- Alert-based monitoring of key support/resistance levels
❌ WHAT IT CANNOT DO:
- Predict direction with certainty
- Replace risk management
- Account for news/external events
- Guarantee profitability
- Work in all market conditions
═════════════════════════════════════════════════════════════
📚 DEVELOPMENT PATH (12-16 Weeks)
═════════════════════════════════════════════════════════════
Weeks 1-2: Observation Only
- Watch price behavior at key levels
- Document patterns without trading
- Set up alerts and observe responses
Weeks 3-8: Paper Trading
- Simulate trades, track all metrics
- Minimum 100 paper trades
- Test different confluence thresholds
Weeks 9-16: Small Size Testing
- Minimal capital, real market conditions
- Continue tracking, refine rules
- Adjust alert sensitivity based on results
After Proven Edge you could potentially include it in your set-up
═════════════════════════════════════════════════════════════
⚠️ CRITICAL DISCLAIMERS
═════════════════════════════════════════════════════════════
⚠️ Past volume ≠ Future price action
⚠️ Institutional positions change rapidly - these are static snapshots
⚠️ No indicator works 100% - risk management is mandatory
⚠️ Market conditions change - adapt your approach
⚠️ Backtest with YOUR style, YOUR timeframe, YOUR risk tolerance
⚠️ Alerts are notifications, not trade signals - you decide the action
The indicator reveals WHERE institutions are positioned and HOW they might behave. YOU decide IF, WHEN, and HOW to trade that information.
═════════════════════════════════════════════════════════════
📞 SUPPORT & UPDATES
═════════════════════════════════════════════════════════════
For questions, suggestions, or bug reports:
- Comment below the indicator
- Follow for updates and new features
- Check documentation for detailed examples
═════════════════════════════════════════════════════════════
Not financial advice. For educational and research purposes only.

Volume and Volatility Crisis Detector Volume + Volatility Crisis Detector Pro
Created by Alphaomega18
🎯 What is the Crisis Detector Pro?
The Volume + Volatility Crisis Detector Pro is an advanced indicator that combines:
8-Level Volume Analysis: Progressive detection of volume anomalies
Hedging Index: Measurement of institutional fear and protection activity
Progressive Crisis Detection: Identification of pre-crisis patterns like 1987 and 2008
📊 Indicator Components
1️⃣ Volume Ratio
Description:
Compares current volume to its 20-period moving average
Normal value: ~1.0 (volume = average)
High value: >2.0 (volume double the average)
Extreme value: >3.0 (volume triple the average)
8-Level Classification:
LevelRatioColorMeaning1< 1.25x⚪ GrayNormal volume21.25-1.5x🟢 GreenEarly alert31.5-1.75x🟡 Light YellowLight increase41.75-2.0x🟡 YellowModerate52.0-2.25x🟠 OrangeSignificant62.25-2.5x🟠 Dark OrangeVery high72.5-3.0x🔴 RedExtreme8> 3.0x🔴 Bright RedCRISIS
2️⃣ Hedging Index
Description:
Estimates institutional hedging activity (protection buying)
Based on: Weighted bearish volume + ATR volatility
Scale: 0.3 to 2.5 (like a Put/Call ratio)
Hedging Levels:
ValueColorMeaning< 0.7🟢 GreenNormal hedging0.7-1.0🟡 YellowElevated hedging1.0-1.3🟠 OrangeHigh hedging> 1.3🔴 RedPANIC - Extreme hedging
Interpretation:
Rising hedging = Institutions protecting → Market fear
Falling hedging = Confidence returning → Possible rebound
⚙️ Main Parameters
Calculations:
Moving Average Period: 20 (reference period for averages)
Volume Classification (8 Levels):
Level 1: 1.25x (early alert)
Level 2: 1.5x (light increase)
Level 3: 1.75x (moderate)
Level 4: 2.0x (significant)
Level 5: 2.25x (high)
Level 6: 2.5x (very high)
Level 7: 3.0x (extreme)
Level 8: > 3.0x (crisis)
Hedging:
Enable Hedging Detection: Enable/disable hedging index
Hedging Period: 14 (smoothing period)
Display:
Show Signals: Display visual signals
📈 Visual Elements
Main Lines:
Volume Ratio (thick colored line): Current volume ratio vs average
🛡️ Hedging Index (thick colored line): Institutional hedging index
Horizontal Threshold Lines:
For Volume:
1.0 = Normal (thick gray line)
1.25 = Level 1 (green dashed)
1.5 = Level 2 (yellow dashed)
2.0 = Level 4 (orange dashed)
3.0 = Level 7 (red dashed)
For Hedging:
0.7 = Normal (thin green dashed)
1.0 = High (thin orange dashed)
1.3 = PANIC (thin red dashed)
Visual Signals:
🔴 Red triangle: Extreme volume (level 7-8)
🟠 Orange triangle: High volume (level 5-6)
🟡 Yellow triangle: Moderate volume (level 3-4)
Colored Background:
Transparent red: Extreme volume or panic hedging
🎯 How to Use the Indicator
1. Installation
Open TradingView
Click "Indicators" at top of chart
Click "Pine Editor" at bottom
Paste the code
Click "Add to Chart"
2. Reading the Chart
Volume Ratio (main line):
Around 1.0 = Normal volume, no alert
Between 1.25 and 2.0 = Volume increasing, watch closely
Above 2.0 = Abnormal volume, strong activity
Above 3.0 = CRISIS - Extreme volume
Hedging Index (hedging line):
Around 0.7 = Calm market
Rising toward 1.0 = Growing nervousness
Above 1.3 = Institutional PANIC
3. Trading Strategies
🟢 Scalping/Day Trading:
Volume Ratio > 2.0:
Scalping opportunity in direction of movement
Quick entries with tight stops
Exit on activity spikes
Hedging Index > 1.0:
Nervous market = bounce opportunities
Wait for confirmation before entering
🟠 Swing Trading:
Volume Ratio > 2.5:
Avoid opening new swing positions
Protect existing positions (trailing stops)
Wait for return to normal (< 1.5)
Hedging Index > 1.3:
Panic = possible capitulation
Look for reversal opportunities
Wait for hedging to drop
🔴 Risk Management:
Volume RatioHedging IndexRecommended Action< 1.5< 0.7Normal trading1.5-2.00.7-1.0Increased monitoring2.0-3.01.0-1.3Reduce exposure 50%> 3.0> 1.3STOP trading / Protection
4. Crisis Patterns (1987/2008 Style)
Pre-Crisis Pattern:
Volume staying above 1.5x for 5+ days
With 3+ days above 2.0x
= Stress accumulation before explosion
Crisis Building Pattern:
5+ consecutive days above 2.0x
Hedging rising progressively
= Crisis is building
Immediate Crisis Pattern:
Volume > 3.0x
Hedging > 1.3
= Widespread PANIC
🔔 Configurable Alerts
The indicator includes 6 main alerts:
🟢 Level 1: First volume anomaly (1.25x)
🔴 Level 6+: Very high volume (2.25x+)
🔴🔴 CRISIS: Extreme volume (3.0x+)
🛡️ PANIC HEDGING: Panic hedging (1.3+)
Configuration:
Right-click on chart
"Create Alert"
Condition: Select desired alert
Options: Set frequency
Actions: Email, notification, webhook, etc.
💡 Real Use Cases
Example 1: Flash Crash
Volume Ratio: 4.5 (🔴)
Hedging Index: 1.8 (🔴)
Signal: EXTREME CRISIS
Action: Full protection, no new trades
Example 2: Fed Announcement
Volume Ratio: 2.3 (🟠)
Hedging Index: 1.1 (🟠)
Signal: High volume and hedging
Action: Reduce positions, wide stops
Example 3: Technical Squeeze
Volume Ratio: 2.8 (🔴)
Hedging Index: 0.9 (🟡)
Signal: Breakout without panic
Action: Follow movement with confirmation
Example 4: Capitulation
Volume Ratio: 3.5 (🔴)
Hedging Index: 1.5 → 0.8 (rapid drop)
Signal: Panic then relief
Action: Look for bounce opportunities
🔧 Parameter Optimization
Scalping (1-5 min):
Moving Average Period: 10
Level 1: 1.2x
Level 4: 1.8x
Level 7: 2.5x
Hedging Period: 7
Day Trading (15min-1H):
Moving Average Period: 20 (default)
All thresholds: Default
Hedging Period: 14 (default)
Swing Trading (4H-Daily):
Moving Average Period: 30-50
Level 1: 1.3x
Level 4: 2.2x
Level 7: 3.5x
Hedging Period: 20
Crypto (Very volatile):
Moving Average Period: 20
Level 1: 1.5x
Level 4: 2.5x
Level 7: 4.0x
Hedging Period: 14
⚠️ Limitations and Best Practices
❌ Limitations:
Hedging is estimated, not based on real Put/Call data
May give false signals in very volatile markets
Requires significant volume to be reliable
✅ Best Practices:
Always combine with classic technical analysis
Never trade solely on alerts
Adapt thresholds to your asset and timeframe
Backtest before using live
Respect your risk management plan
Golden Rule:
"The indicator detects anomalies, not direction. Always wait for confirmation before entering positions."
📈 Performance and Compatibility
✅ Real-time: Instant detection (0 lag)
✅ All markets: Stocks, Futures, Forex, Crypto
✅ All timeframes: 1min to Monthly
✅ Lightweight: Optimized, no slowdown
✅ Multi-platform: TradingView web, mobile, desktop
🎓 Historical Crises
1987 - Black Monday:
Volume Ratio: x5-x10 for several days
Pattern: Progressive increase then explosion
2008 - Lehman Brothers:
Volume Ratio: x3-x7 for weeks
Hedging: Historical record
Pattern: Prolonged stress then panic
2020 - COVID Crash:
Volume Ratio: x4-x8 in few days
Pattern: Rapid fall with intense panic
2022 - Crypto Winter:
Volume Ratio: x2-x4 over several months
Pattern: Successive capitulations
Momentum by Trading BiZonesSqueeze Momentum Indicator with EMA
Overview
The Squeeze Momentum Indicator with EMA is a powerful technical analysis tool that combines the original Squeeze Momentum concept with an Exponential Moving Average (EMA) overlay. This enhanced version helps traders identify market momentum, volatility contractions (squeezes), and potential trend reversals with greater precision.
Core Concept
The indicator operates on the principle of volatility contraction and expansion:
Squeeze Phase: When Bollinger Bands move inside the Keltner Channel, indicating low volatility and potential energy buildup
Expansion Phase: When momentum breaks out of the squeeze, signaling potential directional moves
Key Components
1. Squeeze Momentum Calculation
Formula: Momentum = Linear Regression(Close - Average Price)
Where Average Price = (Highest High + Lowest Low + SMA(Close)) / 3
Visualization: Histogram bars showing positive (green) and negative (red) momentum
Zero Line: Represents equilibrium point between buyers and sellers
2. EMA Overlay
Purpose: Smooths momentum values to identify underlying trends
Customization:
Adjustable period (default: 20)
Toggle on/off display
Customizable color and line thickness
Cross Signals: Buy/sell signals when momentum crosses above/below EMA
3. Volatility Bands
Bollinger Bands (20-period, 2 standard deviations)
Keltner Channels (20-period, 1.5 ATR multiplier)
Squeeze Detection: Visual background shading when BB are inside KC
Trading Signals
Buy Signals (Green Upward Triangle)
Momentum histogram crosses ABOVE EMA line
Occurs during or after squeeze release
Confirmed by expanding histogram bars
Sell Signals (Red Downward Triangle)
Momentum histogram crosses BELOW EMA line
Often precedes market downturns
Watch for increasing negative momentum
Squeeze Warnings (Gray Background)
Market in low volatility state
Prepare for potential breakout
Direction indicated by momentum bias
Indicator Settings
Main Parameters
Length: Period for calculations (default: 20)
Show EMA: Toggle EMA visibility
EMA Period: Smoothing period for EMA
Visual Settings
Histogram color-coding based on momentum direction
EMA line color and thickness
Signal marker size and visibility
Squeeze zone background display
Practical Applications
Trend Identification
Uptrend: Consistently positive momentum with EMA support
Downtrend: Consistently negative momentum with EMA resistance
Range-bound: Oscillating around zero line
Entry/Exit Points
Conservative Entry: Wait for squeeze release + EMA crossover
Aggressive Entry: Anticipate breakout during squeeze
Exit: Opposite crossover or momentum divergence
Risk Management
Use squeeze zones as warning periods
EMA crossovers as confirmation signals
Combine with support/resistance levels
Advanced Interpretation
Momentum Strength
Strong Bullish: Tall green bars above EMA
Weak Bullish: Short green bars near EMA
Strong Bearish: Tall red bars below EMA
Weak Bearish: Short red bars near EMA
Divergence Detection
Price makes higher high, momentum makes lower high → Bearish divergence
Price makes lower low, momentum makes higher low → Bullish divergence
Squeeze Characteristics
Long squeezes: More potential energy
Frequent squeezes: Choppy market conditions
No squeezes: High volatility, trending markets
Recommended Timeframes
Scalping: 1-15 minute charts
Day Trading: 15-minute to 4-hour charts
Swing Trading: 4-hour to daily charts
Position Trading: Daily to weekly charts
Best Practices
Confirmation
Use with volume indicators
Check higher timeframe direction
Wait for candle close confirmation
Filtering Signals
Ignore signals during extreme volatility
Require minimum bar size for crossovers
Consider market context (news, sessions)
Combination Suggestions
With RSI: Confirm overbought/oversold conditions
With Volume Profile: Identify high-volume nodes
With Support/Resistance: Key level reactions
With Trend Lines: Breakout confirmations
Limitations
Lagging indicator (based on past data)
Works best in trending markets
May give false signals in ranging markets
Requires proper risk management
Conclusion
The Squeeze Momentum Indicator with EMA provides a comprehensive view of market dynamics by combining volatility analysis, momentum measurement, and trend smoothing. Its visual clarity and customizable parameters make it suitable for traders of all experience levels seeking to identify high-probability trading opportunities during volatility contractions and expansions.

Adaptive Genesis Engine [AGE]ADAPTIVE GENESIS ENGINE (AGE)
Pure Signal Evolution Through Genetic Algorithms
Where Darwin Meets Technical Analysis
🧬 WHAT YOU'RE GETTING - THE PURE INDICATOR
This is a technical analysis indicator - it generates signals, visualizes probability, and shows you the evolutionary process in real-time. This is NOT a strategy with automatic execution - it's a sophisticated signal generation system that you control .
What This Indicator Does:
Generates Long/Short entry signals with probability scores (35-88% range)
Evolves a population of up to 12 competing strategies using genetic algorithms
Validates strategies through walk-forward optimization (train/test cycles)
Visualizes signal quality through premium gradient clouds and confidence halos
Displays comprehensive metrics via enhanced dashboard
Provides alerts for entries and exits
Works on any timeframe, any instrument, any broker
What This Indicator Does NOT Do:
Execute trades automatically
Manage positions or calculate position sizes
Place orders on your behalf
Make trading decisions for you
This is pure signal intelligence. AGE tells you when and how confident it is. You decide whether and how much to trade.
🔬 THE SCIENCE: GENETIC ALGORITHMS MEET TECHNICAL ANALYSIS
What Makes This Different - The Evolutionary Foundation
Most indicators are static - they use the same parameters forever, regardless of market conditions. AGE is alive . It maintains a population of competing strategies that evolve, adapt, and improve through natural selection principles:
Birth: New strategies spawn through crossover breeding (combining DNA from fit parents) plus random mutation for exploration
Life: Each strategy trades virtually via shadow portfolios, accumulating wins/losses, tracking drawdown, and building performance history
Selection: Strategies are ranked by comprehensive fitness scoring (win rate, expectancy, drawdown control, signal efficiency)
Death: Weak strategies are culled periodically, with elite performers (top 2 by default) protected from removal
Evolution: The gene pool continuously improves as successful traits propagate and unsuccessful ones die out
This is not curve-fitting. Each new strategy must prove itself on out-of-sample data through walk-forward validation before being trusted for live signals.
🧪 THE DNA: WHAT EVOLVES
Every strategy carries a 10-gene chromosome controlling how it interprets market data:
Signal Sensitivity Genes
Entropy Sensitivity (0.5-2.0): Weight given to market order/disorder calculations. Low values = conservative, require strong directional clarity. High values = aggressive, act on weaker order signals.
Momentum Sensitivity (0.5-2.0): Weight given to RSI/ROC/MACD composite. Controls responsiveness to momentum shifts vs. mean-reversion setups.
Structure Sensitivity (0.5-2.0): Weight given to support/resistance positioning. Determines how much price location within swing range matters.
Probability Adjustment Genes
Probability Boost (-0.10 to +0.10): Inherent bias toward aggressive (+) or conservative (-) entries. Acts as personality trait - some strategies naturally optimistic, others pessimistic.
Trend Strength Requirement (0.3-0.8): Minimum trend conviction needed before signaling. Higher values = only trades strong trends, lower values = acts in weak/sideways markets.
Volume Filter (0.5-1.5): Strictness of volume confirmation. Higher values = requires strong volume, lower values = volume less important.
Risk Management Genes
ATR Multiplier (1.5-4.0): Base volatility scaling for all price levels. Controls whether strategy uses tight or wide stops/targets relative to ATR.
Stop Multiplier (1.0-2.5): Stop loss tightness. Lower values = aggressive profit protection, higher values = more breathing room.
Target Multiplier (1.5-4.0): Profit target ambition. Lower values = quick scalping exits, higher values = swing trading holds.
Adaptation Gene
Regime Adaptation (0.0-1.0): How much strategy adjusts behavior based on detected market regime (trending/volatile/choppy). Higher values = more reactive to regime changes.
The Magic: AGE doesn't just try random combinations. Through tournament selection and fitness-weighted crossover, successful gene combinations spread through the population while unsuccessful ones fade away. Over 50-100 bars, you'll see the population converge toward genes that work for YOUR instrument and timeframe.
📊 THE SIGNAL ENGINE: THREE-LAYER SYNTHESIS
Before any strategy generates a signal, AGE calculates probability through multi-indicator confluence:
Layer 1 - Market Entropy (Information Theory)
Measures whether price movements exhibit directional order or random walk characteristics:
The Math:
Shannon Entropy = -Σ(p × log(p))
Market Order = 1 - (Entropy / 0.693)
What It Means:
High entropy = choppy, random market → low confidence signals
Low entropy = directional market → high confidence signals
Direction determined by up-move vs down-move dominance over lookback period (default: 20 bars)
Signal Output: -1.0 to +1.0 (bearish order to bullish order)
Layer 2 - Momentum Synthesis
Combines three momentum indicators into single composite score:
Components:
RSI (40% weight): Normalized to -1/+1 scale using (RSI-50)/50
Rate of Change (30% weight): Percentage change over lookback (default: 14 bars), clamped to ±1
MACD Histogram (30% weight): Fast(12) - Slow(26), normalized by ATR
Why This Matters: RSI catches mean-reversion opportunities, ROC catches raw momentum, MACD catches momentum divergence. Weighting favors RSI for reliability while keeping other perspectives.
Signal Output: -1.0 to +1.0 (strong bearish to strong bullish)
Layer 3 - Structure Analysis
Evaluates price position within swing range (default: 50-bar lookback):
Position Classification:
Bottom 20% of range = Support Zone → bullish bounce potential
Top 20% of range = Resistance Zone → bearish rejection potential
Middle 60% = Neutral Zone → breakout/breakdown monitoring
Signal Logic:
At support + bullish candle = +0.7 (strong buy setup)
At resistance + bearish candle = -0.7 (strong sell setup)
Breaking above range highs = +0.5 (breakout confirmation)
Breaking below range lows = -0.5 (breakdown confirmation)
Consolidation within range = ±0.3 (weak directional bias)
Signal Output: -1.0 to +1.0 (bearish structure to bullish structure)
Confluence Voting System
Each layer casts a vote (Long/Short/Neutral). The system requires minimum 2-of-3 agreement (configurable 1-3) before generating a signal:
Examples:
Entropy: Bullish, Momentum: Bullish, Structure: Neutral → Signal generated (2 long votes)
Entropy: Bearish, Momentum: Neutral, Structure: Neutral → No signal (only 1 short vote)
All three bullish → Signal generated with +5% probability bonus
This is the key to quality. Single indicators give too many false signals. Triple confirmation dramatically improves accuracy.
📈 PROBABILITY CALCULATION: HOW CONFIDENCE IS MEASURED
Base Probability:
Raw_Prob = 50% + (Average_Signal_Strength × 25%)
Then AGE applies strategic adjustments:
Trend Alignment:
Signal with trend: +4%
Signal against strong trend: -8%
Weak/no trend: no adjustment
Regime Adaptation:
Trending market (efficiency >50%, moderate vol): +3%
Volatile market (vol ratio >1.5x): -5%
Choppy market (low efficiency): -2%
Volume Confirmation:
Volume > 70% of 20-bar SMA: no change
Volume below threshold: -3%
Volatility State (DVS Ratio):
High vol (>1.8x baseline): -4% (reduce confidence in chaos)
Low vol (<0.7x baseline): -2% (markets can whipsaw in compression)
Moderate elevated vol (1.0-1.3x): +2% (trending conditions emerging)
Confluence Bonus:
All 3 indicators agree: +5%
2 of 3 agree: +2%
Strategy Gene Adjustment:
Probability Boost gene: -10% to +10%
Regime Adaptation gene: scales regime adjustments by 0-100%
Final Probability: Clamped between 35% (minimum) and 88% (maximum)
Why These Ranges?
Below 35% = too uncertain, better not to signal
Above 88% = unrealistic, creates overconfidence
Sweet spot: 65-80% for quality entries
🔄 THE SHADOW PORTFOLIO SYSTEM: HOW STRATEGIES COMPETE
Each active strategy maintains a virtual trading account that executes in parallel with real-time data:
Shadow Trading Mechanics
Entry Logic:
Calculate signal direction, probability, and confluence using strategy's unique DNA
Check if signal meets quality gate:
Probability ≥ configured minimum threshold (default: 65%)
Confluence ≥ configured minimum (default: 2 of 3)
Direction is not zero (must be long or short, not neutral)
Verify signal persistence:
Base requirement: 2 bars (configurable 1-5)
Adapts based on probability: high-prob signals (75%+) enter 1 bar faster, low-prob signals need 1 bar more
Adjusts for regime: trending markets reduce persistence by 1, volatile markets add 1
Apply additional filters:
Trend strength must exceed strategy's requirement gene
Regime filter: if volatile market detected, probability must be 72%+ to override
Volume confirmation required (volume > 70% of average)
If all conditions met for required persistence bars, enter shadow position at current close price
Position Management:
Entry Price: Recorded at close of entry bar
Stop Loss: ATR-based distance = ATR × ATR_Mult (gene) × Stop_Mult (gene) × DVS_Ratio
Take Profit: ATR-based distance = ATR × ATR_Mult (gene) × Target_Mult (gene) × DVS_Ratio
Position: +1 (long) or -1 (short), only one at a time per strategy
Exit Logic:
Check if price hit stop (on low) or target (on high) on current bar
Record trade outcome in R-multiples (profit/loss normalized by ATR)
Update performance metrics:
Total trades counter incremented
Wins counter (if profit > 0)
Cumulative P&L updated
Peak equity tracked (for drawdown calculation)
Maximum drawdown from peak recorded
Enter cooldown period (default: 8 bars, configurable 3-20) before next entry allowed
Reset signal age counter to zero
Walk-Forward Tracking:
During position lifecycle, trades are categorized:
Training Phase (first 250 bars): Trade counted toward training metrics
Testing Phase (next 75 bars): Trade counted toward testing metrics (out-of-sample)
Live Phase (after WFO period): Trade counted toward overall metrics
Why Shadow Portfolios?
No lookahead bias (uses only data available at the bar)
Realistic execution simulation (entry on close, stop/target checks on high/low)
Independent performance tracking for true fitness comparison
Allows safe experimentation without risking capital
Each strategy learns from its own experience
🏆 FITNESS SCORING: HOW STRATEGIES ARE RANKED
Fitness is not just win rate. AGE uses a comprehensive multi-factor scoring system:
Core Metrics (Minimum 3 trades required)
Win Rate (30% of fitness):
WinRate = Wins / TotalTrades
Normalized directly (0.0-1.0 scale)
Total P&L (30% of fitness):
Normalized_PnL = (PnL + 300) / 600
Clamped 0.0-1.0. Assumes P&L range of -300R to +300R for normalization scale.
Expectancy (25% of fitness):
Expectancy = Total_PnL / Total_Trades
Normalized_Expectancy = (Expectancy + 30) / 60
Clamped 0.0-1.0. Rewards consistency of profit per trade.
Drawdown Control (15% of fitness):
Normalized_DD = 1 - (Max_Drawdown / 15)
Clamped 0.0-1.0. Penalizes strategies that suffer large equity retracements from peak.
Sample Size Adjustment
Quality Factor:
<50 trades: 1.0 (full weight, small sample)
50-100 trades: 0.95 (slight penalty for medium sample)
100 trades: 0.85 (larger penalty for large sample)
Why penalize more trades? Prevents strategies from gaming the system by taking hundreds of tiny trades to inflate statistics. Favors quality over quantity.
Bonus Adjustments
Walk-Forward Validation Bonus:
if (WFO_Validated):
Fitness += (WFO_Efficiency - 0.5) × 0.1
Strategies proven on out-of-sample data receive up to +10% fitness boost based on test/train efficiency ratio.
Signal Efficiency Bonus (if diagnostics enabled):
if (Signals_Evaluated > 10):
Pass_Rate = Signals_Passed / Signals_Evaluated
Fitness += (Pass_Rate - 0.1) × 0.05
Rewards strategies that generate high-quality signals passing the quality gate, not just profitable trades.
Final Fitness: Clamped at 0.0 minimum (prevents negative fitness values)
Result: Elite strategies typically achieve 0.50-0.75 fitness. Anything above 0.60 is excellent. Below 0.30 is prime candidate for culling.
🔬 WALK-FORWARD OPTIMIZATION: ANTI-OVERFITTING PROTECTION
This is what separates AGE from curve-fitted garbage indicators.
The Three-Phase Process
Every new strategy undergoes a rigorous validation lifecycle:
Phase 1 - Training Window (First 250 bars, configurable 100-500):
Strategy trades normally via shadow portfolio
All trades count toward training performance metrics
System learns which gene combinations produce profitable patterns
Tracks independently: Training_Trades, Training_Wins, Training_PnL
Phase 2 - Testing Window (Next 75 bars, configurable 30-200):
Strategy continues trading without any parameter changes
Trades now count toward testing performance metrics (separate tracking)
This is out-of-sample data - strategy has never seen these bars during "optimization"
Tracks independently: Testing_Trades, Testing_Wins, Testing_PnL
Phase 3 - Validation Check:
Minimum_Trades = 5 (configurable 3-15)
IF (Train_Trades >= Minimum AND Test_Trades >= Minimum):
WR_Efficiency = Test_WinRate / Train_WinRate
Expectancy_Efficiency = Test_Expectancy / Train_Expectancy
WFO_Efficiency = (WR_Efficiency + Expectancy_Efficiency) / 2
IF (WFO_Efficiency >= 0.55): // configurable 0.3-0.9
Strategy.Validated = TRUE
Strategy receives fitness bonus
ELSE:
Strategy receives 30% fitness penalty
ELSE:
Validation deferred (insufficient trades in one or both periods)
What Validation Means
Validated Strategy (Green "✓ VAL" in dashboard):
Performed at least 55% as well on unseen data compared to training data
Gets fitness bonus: +(efficiency - 0.5) × 0.1
Receives priority during tournament selection for breeding
More likely to be chosen as active trading strategy
Unvalidated Strategy (Orange "○ TRAIN" in dashboard):
Failed to maintain performance on test data (likely curve-fitted to training period)
Receives 30% fitness penalty (0.7x multiplier)
Makes strategy prime candidate for culling
Can still trade but with lower selection probability
Insufficient Data (continues collecting):
Hasn't completed both training and testing periods yet
OR hasn't achieved minimum trade count in both periods
Validation check deferred until requirements met
Why 55% Efficiency Threshold?
If a strategy earned 10R during training but only 5.5R during testing, it still proved an edge exists beyond random luck. Requiring 100% efficiency would be unrealistic - market conditions change between periods. But requiring >50% ensures the strategy didn't completely degrade on fresh data.
The Protection: Strategies that work great on historical data but fail on new data are automatically identified and penalized. This prevents the population from being polluted by overfitted strategies that would fail in live trading.
🌊 DYNAMIC VOLATILITY SCALING (DVS): ADAPTIVE STOP/TARGET PLACEMENT
AGE doesn't use fixed stop distances. It adapts to current volatility conditions in real-time.
Four Volatility Measurement Methods
1. ATR Ratio (Simple Method):
Current_Vol = ATR(14) / Close
Baseline_Vol = SMA(Current_Vol, 100)
Ratio = Current_Vol / Baseline_Vol
Basic comparison of current ATR to 100-bar moving average baseline.
2. Parkinson (High-Low Range Based):
For each bar: HL = log(High / Low)
Parkinson_Vol = sqrt(Σ(HL²) / (4 × Period × log(2)))
More stable than close-to-close volatility. Captures intraday range expansion without overnight gap noise.
3. Garman-Klass (OHLC Based):
HL_Term = 0.5 × ²
CO_Term = (2×log(2) - 1) × ²
GK_Vol = sqrt(Σ(HL_Term - CO_Term) / Period)
Most sophisticated estimator. Incorporates all four price points (open, high, low, close) plus gap information.
4. Ensemble Method (Default - Median of All Three):
Ratio_1 = ATR_Current / ATR_Baseline
Ratio_2 = Parkinson_Current / Parkinson_Baseline
Ratio_3 = GK_Current / GK_Baseline
DVS_Ratio = Median(Ratio_1, Ratio_2, Ratio_3)
Why Ensemble?
Takes median to avoid outliers and false spikes
If ATR jumps but range-based methods stay calm, median prevents overreaction
If one method fails, other two compensate
Most robust approach across different market conditions
Sensitivity Scaling
Scaled_Ratio = (Raw_Ratio) ^ Sensitivity
Sensitivity 0.3: Cube root - heavily dampens volatility impact
Sensitivity 0.5: Square root - moderate dampening
Sensitivity 0.7 (Default): Balanced response to volatility changes
Sensitivity 1.0: Linear - full 1:1 volatility impact
Sensitivity 1.5: Exponential - amplified response to volatility spikes
Safety Clamps: Final DVS Ratio always clamped between 0.5x and 2.5x baseline to prevent extreme position sizing or stop placement errors.
How DVS Affects Shadow Trading
Every strategy's stop and target distances are multiplied by the current DVS ratio:
Stop Loss Distance:
Stop_Distance = ATR × ATR_Mult (gene) × Stop_Mult (gene) × DVS_Ratio
Take Profit Distance:
Target_Distance = ATR × ATR_Mult (gene) × Target_Mult (gene) × DVS_Ratio
Example Scenario:
ATR = 10 points
Strategy's ATR_Mult gene = 2.5
Strategy's Stop_Mult gene = 1.5
Strategy's Target_Mult gene = 2.5
DVS_Ratio = 1.4 (40% above baseline volatility - market heating up)
Stop = 10 × 2.5 × 1.5 × 1.4 = 52.5 points (vs. 37.5 in normal vol)
Target = 10 × 2.5 × 2.5 × 1.4 = 87.5 points (vs. 62.5 in normal vol)
Result:
During volatility spikes: Stops automatically widen to avoid noise-based exits, targets extend for bigger moves
During calm periods: Stops tighten for better risk/reward, targets compress for realistic profit-taking
Strategies adapt risk management to match current market behavior
🧬 THE EVOLUTIONARY CYCLE: SPAWN, COMPETE, CULL
Initialization (Bar 1)
AGE begins with 4 seed strategies (if evolution enabled):
Seed Strategy #0 (Balanced):
All sensitivities at 1.0 (neutral)
Zero probability boost
Moderate trend requirement (0.4)
Standard ATR/stop/target multiples (2.5/1.5/2.5)
Mid-level regime adaptation (0.5)
Seed Strategy #1 (Momentum-Focused):
Lower entropy sensitivity (0.7), higher momentum (1.5)
Slight probability boost (+0.03)
Higher trend requirement (0.5)
Tighter stops (1.3), wider targets (3.0)
Seed Strategy #2 (Entropy-Driven):
Higher entropy sensitivity (1.5), lower momentum (0.8)
Slight probability penalty (-0.02)
More trend tolerant (0.6)
Wider stops (1.8), standard targets (2.5)
Seed Strategy #3 (Structure-Based):
Balanced entropy/momentum (0.8/0.9), high structure (1.4)
Slight probability boost (+0.02)
Lower trend requirement (0.35)
Moderate risk parameters (1.6/2.8)
All seeds start with WFO validation bypassed if WFO is disabled, or must validate if enabled.
Spawning New Strategies
Timing (Adaptive):
Historical phase: Every 30 bars (configurable 10-100)
Live phase: Every 200 bars (configurable 100-500)
Automatically switches to live timing when barstate.isrealtime triggers
Conditions:
Current population < max population limit (default: 8, configurable 4-12)
At least 2 active strategies exist (need parents)
Available slot in population array
Selection Process:
Run tournament selection 3 times with different seeds
Each tournament: randomly sample active strategies, pick highest fitness
Best from 3 tournaments becomes Parent 1
Repeat independently for Parent 2
Ensures fit parents but maintains diversity
Crossover Breeding:
For each of 10 genes:
Parent1_Fitness = fitness
Parent2_Fitness = fitness
Weight1 = Parent1_Fitness / (Parent1_Fitness + Parent2_Fitness)
Gene1 = parent1's value
Gene2 = parent2's value
Child_Gene = Weight1 × Gene1 + (1 - Weight1) × Gene2
Fitness-weighted crossover ensures fitter parent contributes more genetic material.
Mutation:
For each gene in child:
IF (random < mutation_rate):
Gene_Range = GENE_MAX - GENE_MIN
Noise = (random - 0.5) × 2 × mutation_strength × Gene_Range
Mutated_Gene = Clamp(Child_Gene + Noise, GENE_MIN, GENE_MAX)
Historical mutation rate: 20% (aggressive exploration)
Live mutation rate: 8% (conservative stability)
Mutation strength: 12% of gene range (configurable 5-25%)
Initialization of New Strategy:
Unique ID assigned (total_spawned counter)
Parent ID recorded
Generation = max(parent generations) + 1
Birth bar recorded (for age tracking)
All performance metrics zeroed
Shadow portfolio reset
WFO validation flag set to false (must prove itself)
Result: New strategy with hybrid DNA enters population, begins trading in next bar.
Competition (Every Bar)
All active strategies:
Calculate their signal based on unique DNA
Check quality gate with their thresholds
Manage shadow positions (entries/exits)
Update performance metrics
Recalculate fitness score
Track WFO validation progress
Strategies compete indirectly through fitness ranking - no direct interaction.
Culling Weak Strategies
Timing (Adaptive):
Historical phase: Every 60 bars (configurable 20-200, should be 2x spawn interval)
Live phase: Every 400 bars (configurable 200-1000, should be 2x spawn interval)
Minimum Adaptation Score (MAS):
Initial MAS = 0.10
MAS decays: MAS × 0.995 every cull cycle
Minimum MAS = 0.03 (floor)
MAS represents the "survival threshold" - strategies below this fitness level are vulnerable.
Culling Conditions (ALL must be true):
Population > minimum population (default: 3, configurable 2-4)
At least one strategy has fitness < MAS
Strategy's age > culling interval (prevents premature culling of new strategies)
Strategy is not in top N elite (default: 2, configurable 1-3)
Culling Process:
Find worst strategy:
For each active strategy:
IF (age > cull_interval):
Fitness = base_fitness
IF (not WFO_validated AND WFO_enabled):
Fitness × 0.7 // 30% penalty for unvalidated
IF (Fitness < MAS AND Fitness < worst_fitness_found):
worst_strategy = this_strategy
worst_fitness = Fitness
IF (worst_strategy found):
Count elite strategies with fitness > worst_fitness
IF (elite_count >= elite_preservation_count):
Deactivate worst_strategy (set active flag = false)
Increment total_culled counter
Elite Protection:
Even if a strategy's fitness falls below MAS, it survives if fewer than N strategies are better. This prevents culling when population is generally weak.
Result: Weak strategies removed from population, freeing slots for new spawns. Gene pool improves over time.
Selection for Display (Every Bar)
AGE chooses one strategy to display signals:
Best fitness = -1
Selected = none
For each active strategy:
Fitness = base_fitness
IF (WFO_validated):
Fitness × 1.3 // 30% bonus for validated strategies
IF (Fitness > best_fitness):
best_fitness = Fitness
selected_strategy = this_strategy
Display selected strategy's signals on chart
Result: Only the highest-fitness (optionally validated-boosted) strategy's signals appear as chart markers. Other strategies trade invisibly in shadow portfolios.
🎨 PREMIUM VISUALIZATION SYSTEM
AGE includes sophisticated visual feedback that standard indicators lack:
1. Gradient Probability Cloud (Optional, Default: ON)
Multi-layer gradient showing signal buildup 2-3 bars before entry:
Activation Conditions:
Signal persistence > 0 (same directional signal held for multiple bars)
Signal probability ≥ minimum threshold (65% by default)
Signal hasn't yet executed (still in "forming" state)
Visual Construction:
7 gradient layers by default (configurable 3-15)
Each layer is a line-fill pair (top line, bottom line, filled between)
Layer spacing: 0.3 to 1.0 × ATR above/below price
Outer layers = faint, inner layers = bright
Color transitions from base to intense based on layer position
Transparency scales with probability (high prob = more opaque)
Color Selection:
Long signals: Gradient from theme.gradient_bull_mid to theme.gradient_bull_strong
Short signals: Gradient from theme.gradient_bear_mid to theme.gradient_bear_strong
Base transparency: 92%, reduces by up to 8% for high-probability setups
Dynamic Behavior:
Cloud grows/shrinks as signal persistence increases/decreases
Redraws every bar while signal is forming
Disappears when signal executes or invalidates
Performance Note: Computationally expensive due to linefill objects. Disable or reduce layers if chart performance degrades.
2. Population Fitness Ribbon (Optional, Default: ON)
Histogram showing fitness distribution across active strategies:
Activation: Only draws on last bar (barstate.islast) to avoid historical clutter
Visual Construction:
10 histogram layers by default (configurable 5-20)
Plots 50 bars back from current bar
Positioned below price at: lowest_low(100) - 1.5×ATR (doesn't interfere with price action)
Each layer represents a fitness threshold (evenly spaced min to max fitness)
Layer Logic:
For layer_num from 0 to ribbon_layers:
Fitness_threshold = min_fitness + (max_fitness - min_fitness) × (layer / layers)
Count strategies with fitness ≥ threshold
Height = ATR × 0.15 × (count / total_active)
Y_position = base_level + ATR × 0.2 × layer
Color = Gradient from weak to strong based on layer position
Line_width = Scaled by height (taller = thicker)
Visual Feedback:
Tall, bright ribbon = healthy population, many fit strategies at high fitness levels
Short, dim ribbon = weak population, few strategies achieving good fitness
Ribbon compression (layers close together) = population converging to similar fitness
Ribbon spread = diverse fitness range, active selection pressure
Use Case: Quick visual health check without opening dashboard. Ribbon growing upward over time = population improving.
3. Confidence Halo (Optional, Default: ON)
Circular polyline around entry signals showing probability strength:
Activation: Draws when new position opens (shadow_position changes from 0 to ±1)
Visual Construction:
20-segment polyline forming approximate circle
Center: Low - 0.5×ATR (long) or High + 0.5×ATR (short)
Radius: 0.3×ATR (low confidence) to 1.0×ATR (elite confidence)
Scales with: (probability - min_probability) / (1.0 - min_probability)
Color Coding:
Elite (85%+): Cyan (theme.conf_elite), large radius, minimal transparency (40%)
Strong (75-85%): Strong green (theme.conf_strong), medium radius, moderate transparency (50%)
Good (65-75%): Good green (theme.conf_good), smaller radius, more transparent (60%)
Moderate (<65%): Moderate green (theme.conf_moderate), tiny radius, very transparent (70%)
Technical Detail:
Uses chart.point array with index-based positioning
5-bar horizontal spread for circular appearance (±5 bars from entry)
Curved=false (Pine Script polyline limitation)
Fill color matches line color but more transparent (88% vs line's transparency)
Purpose: Instant visual probability assessment. No need to check dashboard - halo size/brightness tells the story.
4. Evolution Event Markers (Optional, Default: ON)
Visual indicators of genetic algorithm activity:
Spawn Markers (Diamond, Cyan):
Plots when total_spawned increases on current bar
Location: bottom of chart (location.bottom)
Color: theme.spawn_marker (cyan/bright blue)
Size: tiny
Indicates new strategy just entered population
Cull Markers (X-Cross, Red):
Plots when total_culled increases on current bar
Location: bottom of chart (location.bottom)
Color: theme.cull_marker (red/pink)
Size: tiny
Indicates weak strategy just removed from population
What It Tells You:
Frequent spawning early = population building, active exploration
Frequent culling early = high selection pressure, weak strategies dying fast
Balanced spawn/cull = healthy evolutionary churn
No markers for long periods = stable population (evolution plateaued or optimal genes found)
5. Entry/Exit Markers
Clear visual signals for selected strategy's trades:
Long Entry (Triangle Up, Green):
Plots when selected strategy opens long position (position changes 0 → +1)
Location: below bar (location.belowbar)
Color: theme.long_primary (green/cyan depending on theme)
Transparency: Scales with probability:
Elite (85%+): 0% (fully opaque)
Strong (75-85%): 10%
Good (65-75%): 20%
Acceptable (55-65%): 35%
Size: small
Short Entry (Triangle Down, Red):
Plots when selected strategy opens short position (position changes 0 → -1)
Location: above bar (location.abovebar)
Color: theme.short_primary (red/pink depending on theme)
Transparency: Same scaling as long entries
Size: small
Exit (X-Cross, Orange):
Plots when selected strategy closes position (position changes ±1 → 0)
Location: absolute (at actual exit price if stop/target lines enabled)
Color: theme.exit_color (orange/yellow depending on theme)
Transparency: 0% (fully opaque)
Size: tiny
Result: Clean, probability-scaled markers that don't clutter chart but convey essential information.
6. Stop Loss & Take Profit Lines (Optional, Default: ON)
Visual representation of shadow portfolio risk levels:
Stop Loss Line:
Plots when selected strategy has active position
Level: shadow_stop value from selected strategy
Color: theme.short_primary with 60% transparency (red/pink, subtle)
Width: 2
Style: plot.style_linebr (breaks when no position)
Take Profit Line:
Plots when selected strategy has active position
Level: shadow_target value from selected strategy
Color: theme.long_primary with 60% transparency (green, subtle)
Width: 2
Style: plot.style_linebr (breaks when no position)
Purpose:
Shows where shadow portfolio would exit for stop/target
Helps visualize strategy's risk/reward ratio
Useful for manual traders to set similar levels
Disable for cleaner chart (recommended for presentations)
7. Dynamic Trend EMA
Gradient-colored trend line that visualizes trend strength:
Calculation:
EMA(close, trend_length) - default 50 period (configurable 20-100)
Slope calculated over 10 bars: (current_ema - ema ) / ema × 100
Color Logic:
Trend_direction:
Slope > 0.1% = Bullish (1)
Slope < -0.1% = Bearish (-1)
Otherwise = Neutral (0)
Trend_strength = abs(slope)
Color = Gradient between:
- Neutral color (gray/purple)
- Strong bullish (bright green) if direction = 1
- Strong bearish (bright red) if direction = -1
Gradient factor = trend_strength (0 to 1+ scale)
Visual Behavior:
Faint gray/purple = weak/no trend (choppy conditions)
Light green/red = emerging trend (low strength)
Bright green/red = strong trend (high conviction)
Color intensity = trend strength magnitude
Transparency: 50% (subtle, doesn't overpower price action)
Purpose: Subconscious awareness of trend state without checking dashboard or indicators.
8. Regime Background Tinting (Subtle)
Ultra-low opacity background color indicating detected market regime:
Regime Detection:
Efficiency = directional_movement / total_range (over trend_length bars)
Vol_ratio = current_volatility / average_volatility
IF (efficiency > 0.5 AND vol_ratio < 1.3):
Regime = Trending (1)
ELSE IF (vol_ratio > 1.5):
Regime = Volatile (2)
ELSE:
Regime = Choppy (0)
Background Colors:
Trending: theme.regime_trending (dark green, 92-93% transparency)
Volatile: theme.regime_volatile (dark red, 93% transparency)
Choppy: No tint (normal background)
Purpose:
Subliminal regime awareness
Helps explain why signals are/aren't generating
Trending = ideal conditions for AGE
Volatile = fewer signals, higher thresholds applied
Choppy = mixed signals, lower confidence
Important: Extremely subtle by design. Not meant to be obvious, just subconscious context.
📊 ENHANCED DASHBOARD
Comprehensive real-time metrics in single organized panel (top-right position):
Dashboard Structure (5 columns × 14 rows)
Header Row:
Column 0: "🧬 AGE PRO" + phase indicator (🔴 LIVE or ⏪ HIST)
Column 1: "POPULATION"
Column 2: "PERFORMANCE"
Column 3: "CURRENT SIGNAL"
Column 4: "ACTIVE STRATEGY"
Column 0: Market State
Regime (📈 TREND / 🌊 CHAOS / ➖ CHOP)
DVS Ratio (current volatility scaling factor, format: #.##)
Trend Direction (▲ BULL / ▼ BEAR / ➖ FLAT with color coding)
Trend Strength (0-100 scale, format: #.##)
Column 1: Population Metrics
Active strategies (count / max_population)
Validated strategies (WFO passed / active total)
Current generation number
Total spawned (all-time strategy births)
Total culled (all-time strategy deaths)
Column 2: Aggregate Performance
Total trades across all active strategies
Aggregate win rate (%) - color-coded:
Green (>55%)
Orange (45-55%)
Red (<45%)
Total P&L in R-multiples - color-coded by positive/negative
Best fitness score in population (format: #.###)
MAS - Minimum Adaptation Score (cull threshold, format: #.###)
Column 3: Current Signal Status
Status indicator:
"▲ LONG" (green) if selected strategy in long position
"▼ SHORT" (red) if selected strategy in short position
"⏳ FORMING" (orange) if signal persisting but not yet executed
"○ WAITING" (gray) if no active signal
Confidence percentage (0-100%, format: #.#%)
Quality assessment:
"🔥 ELITE" (cyan) for 85%+ probability
"✓ STRONG" (bright green) for 75-85%
"○ GOOD" (green) for 65-75%
"- LOW" (dim) for <65%
Confluence score (X/3 format)
Signal age:
"X bars" if signal forming
"IN TRADE" if position active
"---" if no signal
Column 4: Selected Strategy Details
Strategy ID number (#X format)
Validation status:
"✓ VAL" (green) if WFO validated
"○ TRAIN" (orange) if still in training/testing phase
Generation number (GX format)
Personal fitness score (format: #.### with color coding)
Trade count
P&L and win rate (format: #.#R (##%) with color coding)
Color Scheme:
Panel background: theme.panel_bg (dark, low opacity)
Panel headers: theme.panel_header (slightly lighter)
Primary text: theme.text_primary (bright, high contrast)
Secondary text: theme.text_secondary (dim, lower contrast)
Positive metrics: theme.metric_positive (green)
Warning metrics: theme.metric_warning (orange)
Negative metrics: theme.metric_negative (red)
Special markers: theme.validated_marker, theme.spawn_marker
Update Frequency: Only on barstate.islast (current bar) to minimize CPU usage
Purpose:
Quick overview of entire system state
No need to check multiple indicators
Trading decisions informed by population health, regime state, and signal quality
Transparency into what AGE is thinking
🔍 DIAGNOSTICS PANEL (Optional, Default: OFF)
Detailed signal quality tracking for optimization and debugging:
Panel Structure (3 columns × 8 rows)
Position: Bottom-right corner (doesn't interfere with main dashboard)
Header Row:
Column 0: "🔍 DIAGNOSTICS"
Column 1: "COUNT"
Column 2: "%"
Metrics Tracked (for selected strategy only):
Total Evaluated:
Every signal that passed initial calculation (direction ≠ 0)
Represents total opportunities considered
✓ Passed:
Signals that passed quality gate and executed
Green color coding
Percentage of evaluated signals
Rejection Breakdown:
⨯ Probability:
Rejected because probability < minimum threshold
Most common rejection reason typically
⨯ Confluence:
Rejected because confluence < minimum required (e.g., only 1 of 3 indicators agreed)
⨯ Trend:
Rejected because signal opposed strong trend
Indicates counter-trend protection working
⨯ Regime:
Rejected because volatile regime detected and probability wasn't high enough to override
Shows regime filter in action
⨯ Volume:
Rejected because volume < 70% of 20-bar average
Indicates volume confirmation requirement
Color Coding:
Passed count: Green (success metric)
Rejection counts: Red (failure metrics)
Percentages: Gray (neutral, informational)
Performance Cost: Slight CPU overhead for tracking counters. Disable when not actively optimizing settings.
How to Use Diagnostics
Scenario 1: Too Few Signals
Evaluated: 200
Passed: 10 (5%)
⨯ Probability: 120 (60%)
⨯ Confluence: 40 (20%)
⨯ Others: 30 (15%)
Diagnosis: Probability threshold too high for this strategy's DNA.
Solution: Lower min probability from 65% to 60%, or allow strategy more time to evolve better DNA.
Scenario 2: Too Many False Signals
Evaluated: 200
Passed: 80 (40%)
Strategy win rate: 45%
Diagnosis: Quality gate too loose, letting low-quality signals through.
Solution: Raise min probability to 70%, or increase min confluence to 3 (all indicators must agree).
Scenario 3: Regime-Specific Issues
⨯ Regime: 90 (45% of rejections)
Diagnosis: Frequent volatile regime detection blocking otherwise good signals.
Solution: Either accept fewer trades during chaos (recommended), or disable regime filter if you want signals regardless of market state.
Optimization Workflow:
Enable diagnostics
Run 200+ bars
Analyze rejection patterns
Adjust settings based on data
Re-run and compare pass rate
Disable diagnostics when satisfied
⚙️ CONFIGURATION GUIDE
🧬 Evolution Engine Settings
Enable AGE Evolution (Default: ON):
ON: Full genetic algorithm (recommended for best results)
OFF: Uses only 4 seed strategies, no spawning/culling (static population for comparison testing)
Max Population (4-12, Default: 8):
Higher = more diversity, more exploration, slower performance
Lower = faster computation, less exploration, risk of premature convergence
Sweet spot: 6-8 for most use cases
4 = minimum for meaningful evolution
12 = maximum before diminishing returns
Min Population (2-4, Default: 3):
Safety floor - system never culls below this count
Prevents population extinction during harsh selection
Should be at least half of max population
Elite Preservation (1-3, Default: 2):
Top N performers completely immune to culling
Ensures best genes always survive
1 = minimal protection, aggressive selection
2 = balanced (recommended)
3 = conservative, slower gene pool turnover
Historical: Spawn Interval (10-100, Default: 30):
Bars between spawning new strategies during historical data
Lower = faster evolution, more exploration
Higher = slower evolution, more evaluation time per strategy
30 bars = ~1-2 hours on 15min chart
Historical: Cull Interval (20-200, Default: 60):
Bars between culling weak strategies during historical data
Should be 2x spawn interval for balanced churn
Lower = aggressive selection pressure
Higher = patient evaluation
Live: Spawn Interval (100-500, Default: 200):
Bars between spawning during live trading
Much slower than historical for stability
Prevents population chaos during live trading
200 bars = ~1.5 trading days on 15min chart
Live: Cull Interval (200-1000, Default: 400):
Bars between culling during live trading
Should be 2x live spawn interval
Conservative removal during live trading
Historical: Mutation Rate (0.05-0.40, Default: 0.20):
Probability each gene mutates during breeding (20% = 2 out of 10 genes on average)
Higher = more exploration, slower convergence
Lower = more exploitation, faster convergence but risk of local optima
20% balances exploration vs exploitation
Live: Mutation Rate (0.02-0.20, Default: 0.08):
Mutation rate during live trading
Much lower for stability (don't want population to suddenly degrade)
8% = mostly inherits parent genes with small tweaks
Mutation Strength (0.05-0.25, Default: 0.12):
How much genes change when mutated (% of gene's total range)
0.05 = tiny nudges (fine-tuning)
0.12 = moderate jumps (recommended)
0.25 = large leaps (aggressive exploration)
Example: If gene range is 0.5-2.0, 12% strength = ±0.18 possible change
📈 Signal Quality Settings
Min Signal Probability (0.55-0.80, Default: 0.65):
Quality gate threshold - signals below this never generate
0.55-0.60 = More signals, accept lower confidence (higher risk)
0.65 = Institutional-grade balance (recommended)
0.70-0.75 = Fewer but higher-quality signals (conservative)
0.80+ = Very selective, very few signals (ultra-conservative)
Min Confluence Score (1-3, Default: 2):
Required indicator agreement before signal generates
1 = Any single indicator can trigger (not recommended - too many false signals)
2 = Requires 2 of 3 indicators agree (RECOMMENDED for balance)
3 = All 3 must agree (very selective, few signals, high quality)
Base Persistence Bars (1-5, Default: 2):
Base bars signal must persist before entry
System adapts automatically:
High probability signals (75%+) enter 1 bar faster
Low probability signals (<68%) need 1 bar more
Trending regime: -1 bar (faster entries)
Volatile regime: +1 bar (more confirmation)
1 = Immediate entry after quality gate (responsive but prone to whipsaw)
2 = Balanced confirmation (recommended)
3-5 = Patient confirmation (slower but more reliable)
Cooldown After Trade (3-20, Default: 8):
Bars to wait after exit before next entry allowed
Prevents overtrading and revenge trading
3 = Minimal cooldown (active trading)
8 = Balanced (recommended)
15-20 = Conservative (position trading)
Entropy Length (10-50, Default: 20):
Lookback period for market order/disorder calculation
Lower = more responsive to regime changes (noisy)
Higher = more stable regime detection (laggy)
20 = works across most timeframes
Momentum Length (5-30, Default: 14):
Period for RSI/ROC calculations
14 = standard (RSI default)
Lower = more signals, less reliable
Higher = fewer signals, more reliable
Structure Length (20-100, Default: 50):
Lookback for support/resistance swing range
20 = short-term swings (day trading)
50 = medium-term structure (recommended)
100 = major structure (position trading)
Trend EMA Length (20-100, Default: 50):
EMA period for trend detection and direction bias
20 = short-term trend (responsive)
50 = medium-term trend (recommended)
100 = long-term trend (position trading)
ATR Period (5-30, Default: 14):
Period for volatility measurement
14 = standard ATR
Lower = more responsive to vol changes
Higher = smoother vol calculation
📊 Volatility Scaling (DVS) Settings
Enable DVS (Default: ON):
Dynamic volatility scaling for adaptive stop/target placement
Highly recommended to leave ON
OFF only for testing fixed-distance stops
DVS Method (Default: Ensemble):
ATR Ratio: Simple, fast, single-method (good for beginners)
Parkinson: High-low range based (good for intraday)
Garman-Klass: OHLC based (sophisticated, considers gaps)
Ensemble: Median of all three (RECOMMENDED - most robust)
DVS Memory (20-200, Default: 100):
Lookback for baseline volatility comparison
20 = very responsive to vol changes (can overreact)
100 = balanced adaptation (recommended)
200 = slow, stable baseline (minimizes false vol signals)
DVS Sensitivity (0.3-1.5, Default: 0.7):
How much volatility affects scaling (power-law exponent)
0.3 = Conservative, heavily dampens vol impact (cube root)
0.5 = Moderate dampening (square root)
0.7 = Balanced response (recommended)
1.0 = Linear, full 1:1 vol response
1.5 = Aggressive, amplified response (exponential)
🔬 Walk-Forward Optimization Settings
Enable WFO (Default: ON):
Out-of-sample validation to prevent overfitting
Highly recommended to leave ON
OFF only for testing or if you want unvalidated strategies
Training Window (100-500, Default: 250):
Bars for in-sample optimization
100 = fast validation, less data (risky)
250 = balanced (recommended) - about 1-2 months on daily, 1-2 weeks on 15min
500 = patient validation, more data (conservative)
Testing Window (30-200, Default: 75):
Bars for out-of-sample validation
Should be ~30% of training window
30 = minimal test (fast validation)
75 = balanced (recommended)
200 = extensive test (very conservative)
Min Trades for Validation (3-15, Default: 5):
Required trades in BOTH training AND testing periods
3 = minimal sample (risky, fast validation)
5 = balanced (recommended)
10+ = conservative (slow validation, high confidence)
WFO Efficiency Threshold (0.3-0.9, Default: 0.55):
Minimum test/train performance ratio required
0.30 = Very loose (test must be 30% as good as training)
0.55 = Balanced (recommended) - test must be 55% as good
0.70+ = Strict (test must closely match training)
Higher = fewer validated strategies, lower risk of overfitting
🎨 Premium Visuals Settings
Visual Theme:
Neon Genesis: Cyberpunk aesthetic (cyan/magenta/purple)
Carbon Fiber: Industrial look (blue/red/gray)
Quantum Blue: Quantum computing (blue/purple/pink)
Aurora: Northern lights (teal/orange/purple)
⚡ Gradient Probability Cloud (Default: ON):
Multi-layer gradient showing signal buildup
Turn OFF if chart lags or for cleaner look
Cloud Gradient Layers (3-15, Default: 7):
More layers = smoother gradient, more CPU intensive
Fewer layers = faster, blockier appearance
🎗️ Population Fitness Ribbon (Default: ON):
Histogram showing fitness distribution
Turn OFF for cleaner chart
Ribbon Layers (5-20, Default: 10):
More layers = finer fitness detail
Fewer layers = simpler histogram
⭕ Signal Confidence Halo (Default: ON):
Circular indicator around entry signals
Size/brightness scales with probability
Minimal performance cost
🔬 Evolution Event Markers (Default: ON):
Diamond (spawn) and X (cull) markers
Shows genetic algorithm activity
Minimal performance cost
🎯 Stop/Target Lines (Default: ON):
Shows shadow portfolio stop/target levels
Turn OFF for cleaner chart (recommended for screenshots/presentations)
📊 Enhanced Dashboard (Default: ON):
Comprehensive metrics panel
Should stay ON unless you want zero overlays
🔍 Diagnostics Panel (Default: OFF):
Detailed signal rejection tracking
Turn ON when optimizing settings
Turn OFF during normal use (slight performance cost)
📈 USAGE WORKFLOW - HOW TO USE THIS INDICATOR
Phase 1: Initial Setup & Learning
Add AGE to your chart
Recommended timeframes: 15min, 30min, 1H (best signal-to-noise ratio)
Works on: 5min (day trading), 4H (swing trading), Daily (position trading)
Load 1000+ bars for sufficient evolution history
Let the population evolve (100+ bars minimum)
First 50 bars: Random exploration, poor results expected
Bars 50-150: Population converging, fitness improving
Bars 150+: Stable performance, validated strategies emerging
Watch the dashboard metrics
Population should grow toward max capacity
Generation number should advance regularly
Validated strategies counter should increase
Best fitness should trend upward toward 0.50-0.70 range
Observe evolution markers
Diamond markers (cyan) = new strategies spawning
X markers (red) = weak strategies being culled
Frequent early activity = healthy evolution
Activity slowing = population stabilizing
Be patient. Evolution takes time. Don't judge performance before 150+ bars.
Phase 2: Signal Observation
Watch signals form
Gradient cloud builds up 2-3 bars before entry
Cloud brightness = probability strength
Cloud thickness = signal persistence
Check signal quality
Look at confidence halo size when entry marker appears
Large bright halo = elite setup (85%+)
Medium halo = strong setup (75-85%)
Small halo = good setup (65-75%)
Verify market conditions
Check trend EMA color (green = uptrend, red = downtrend, gray = choppy)
Check background tint (green = trending, red = volatile, clear = choppy)
Trending background + aligned signal = ideal conditions
Review dashboard signal status
Current Signal column shows:
Status (Long/Short/Forming/Waiting)
Confidence % (actual probability value)
Quality assessment (Elite/Strong/Good)
Confluence score (2/3 or 3/3 preferred)
Only signals meeting ALL quality gates appear on chart. If you're not seeing signals, population is either still learning or market conditions aren't suitable.
Phase 3: Manual Trading Execution
When Long Signal Fires:
Verify confidence level (dashboard or halo size)
Confirm trend alignment (EMA sloping up, green color)
Check regime (preferably trending or choppy, avoid volatile)
Enter long manually on your broker platform
Set stop loss at displayed stop line level (if lines enabled), or use your own risk management
Set take profit at displayed target line level, or trail manually
Monitor position - exit if X marker appears (signal reversal)
When Short Signal Fires:
Same verification process
Confirm downtrend (EMA sloping down, red color)
Enter short manually
Use displayed stop/target levels or your own
AGE tells you WHEN and HOW CONFIDENT. You decide WHETHER and HOW MUCH.
Phase 4: Set Up Alerts (Never Miss a Signal)
Right-click on indicator name in legend
Select "Add Alert"
Choose condition:
"AGE Long" = Long entry signal fired
"AGE Short" = Short entry signal fired
"AGE Exit" = Position reversal/exit signal
Set notification method:
Sound alert (popup on chart)
Email notification
Webhook to phone/trading platform
Mobile app push notification
Name the alert (e.g., "AGE BTCUSD 15min Long")
Save alert
Recommended: Set alerts for both long and short, enable mobile push notifications. You'll get alerted in real-time even if not watching charts.
Phase 5: Monitor Population Health
Weekly Review:
Check dashboard Population column:
Active count should be near max (6-8 of 8)
Validated count should be >50% of active
Generation should be advancing (1-2 per week typical)
Check dashboard Performance column:
Aggregate win rate should be >50% (target: 55-65%)
Total P&L should be positive (may fluctuate)
Best fitness should be >0.50 (target: 0.55-0.70)
MAS should be declining slowly (normal adaptation)
Check Active Strategy column:
Selected strategy should be validated (✓ VAL)
Personal fitness should match best fitness
Trade count should be accumulating
Win rate should be >50%
Warning Signs:
Zero validated strategies after 300+ bars = settings too strict or market unsuitable
Best fitness stuck <0.30 = population struggling, consider parameter adjustment
No spawning/culling for 200+ bars = evolution stalled (may be optimal or need reset)
Aggregate win rate <45% sustained = system not working on this instrument/timeframe
Health Check Pass:
50%+ strategies validated
Best fitness >0.50
Aggregate win rate >52%
Regular spawn/cull activity
Selected strategy validated
Phase 6: Optimization (If Needed)
Enable Diagnostics Panel (bottom-right) for data-driven tuning:
Problem: Too Few Signals
Evaluated: 200
Passed: 8 (4%)
⨯ Probability: 140 (70%)
Solutions:
Lower min probability: 65% → 60% or 55%
Reduce min confluence: 2 → 1
Lower base persistence: 2 → 1
Increase mutation rate temporarily to explore new genes
Check if regime filter is blocking signals (⨯ Regime high?)
Problem: Too Many False Signals
Evaluated: 200
Passed: 90 (45%)
Win rate: 42%
Solutions:
Raise min probability: 65% → 70% or 75%
Increase min confluence: 2 → 3
Raise base persistence: 2 → 3
Enable WFO if disabled (validates strategies before use)
Check if volume filter is being ignored (⨯ Volume low?)
Problem: Counter-Trend Losses
⨯ Trend: 5 (only 5% rejected)
Losses often occur against trend
Solutions:
System should already filter trend opposition
May need stronger trend requirement
Consider only taking signals aligned with higher timeframe trend
Use longer trend EMA (50 → 100)
Problem: Volatile Market Whipsaws
⨯ Regime: 100 (50% rejected by volatile regime)
Still getting stopped out frequently
Solutions:
System is correctly blocking volatile signals
Losses happening because vol filter isn't strict enough
Consider not trading during volatile periods (respect the regime)
Or disable regime filter and accept higher risk
Optimization Workflow:
Enable diagnostics
Run 200+ bars with current settings
Analyze rejection patterns and win rate
Make ONE change at a time (scientific method)
Re-run 200+ bars and compare results
Keep change if improvement, revert if worse
Disable diagnostics when satisfied
Never change multiple parameters at once - you won't know what worked.
Phase 7: Multi-Instrument Deployment
AGE learns independently on each chart:
Recommended Strategy:
Deploy AGE on 3-5 different instruments
Different asset classes ideal (e.g., ES futures, EURUSD, BTCUSD, SPY, Gold)
Each learns optimal strategies for that instrument's personality
Take signals from all 5 charts
Natural diversification reduces overall risk
Why This Works:
When one market is choppy, others may be trending
Different instruments respond to different news/catalysts
Portfolio-level win rate more stable than single-instrument
Evolution explores different parameter spaces on each chart
Setup:
Same settings across all charts (or customize if preferred)
Set alerts for all
Take every validated signal across all instruments
Position size based on total account (don't overleverage any single signal)
⚠️ REALISTIC EXPECTATIONS - CRITICAL READING
What AGE Can Do
✅ Generate probability-weighted signals using genetic algorithms
✅ Evolve strategies in real-time through natural selection
✅ Validate strategies on out-of-sample data (walk-forward optimization)
✅ Adapt to changing market conditions automatically over time
✅ Provide comprehensive metrics on population health and signal quality
✅ Work on any instrument, any timeframe, any broker
✅ Improve over time as weak strategies are culled and fit strategies breed
What AGE Cannot Do
❌ Win every trade (typical win rate: 55-65% at best)
❌ Predict the future with certainty (markets are probabilistic, not deterministic)
❌ Work perfectly from bar 1 (needs 100-150 bars to learn and stabilize)
❌ Guarantee profits under all market conditions
❌ Replace your trading discipline and risk management
❌ Execute trades automatically (this is an indicator, not a strategy)
❌ Prevent all losses (drawdowns are normal and expected)
❌ Adapt instantly to regime changes (re-learning takes 50-100 bars)
Performance Realities
Typical Performance After Evolution Stabilizes (150+ bars):
Win Rate: 55-65% (excellent for trend-following systems)
Profit Factor: 1.5-2.5 (realistic for validated strategies)
Signal Frequency: 5-15 signals per 100 bars (quality over quantity)
Drawdown Periods: 20-40% of time in equity retracement (normal trading reality)
Max Consecutive Losses: 5-8 losses possible even with 60% win rate (probability says this is normal)
Evolution Timeline:
Bars 0-50: Random exploration, learning phase - poor results expected, don't judge yet
Bars 50-150: Population converging, fitness climbing - results improving
Bars 150-300: Stable performance, most strategies validated - consistent results
Bars 300+: Mature population, optimal genes dominant - best results
Market Condition Dependency:
Trending Markets: AGE excels - clear directional moves, high-probability setups
Choppy Markets: AGE struggles - fewer signals generated, lower win rate
Volatile Markets: AGE cautious - higher rejection rate, wider stops, fewer trades
Market Regime Changes:
When market shifts from trending to choppy overnight
Validated strategies can become temporarily invalidated
AGE will adapt through evolution, but not instantly
Expect 50-100 bar re-learning period after major regime shifts
Fitness may temporarily drop then recover
This is NOT a holy grail. It's a sophisticated signal generator that learns and adapts using genetic algorithms. Your success depends on:
Patience during learning periods (don't abandon after 3 losses)
Proper position sizing (risk 0.5-2% per trade, not 10%)
Following signals consistently (cherry-picking defeats statistical edge)
Not abandoning system prematurely (give it 200+ bars minimum)
Understanding probability (60% win rate means 40% of trades WILL lose)
Respecting market conditions (trending = trade more, choppy = trade less)
Managing emotions (AGE is emotionless, you need to be too)
Expected Drawdowns:
Single-strategy max DD: 10-20% of equity (normal)
Portfolio across multiple instruments: 5-15% (diversification helps)
Losing streaks: 3-5 consecutive losses expected periodically
No indicator eliminates risk. AGE manages risk through:
Quality gates (rejecting low-probability signals)
Confluence requirements (multi-indicator confirmation)
Persistence requirements (no knee-jerk reactions)
Regime awareness (reduced trading in chaos)
Walk-forward validation (preventing overfitting)
But it cannot prevent all losses. That's inherent to trading.
🔧 TECHNICAL SPECIFICATIONS
Platform: TradingView Pine Script v5
Indicator Type: Overlay indicator (plots on price chart)
Execution Type: Signals only - no automatic order placement
Computational Load:
Moderate to High (genetic algorithms + shadow portfolios)
8 strategies × shadow portfolio simulation = significant computation
Premium visuals add additional load (gradient cloud, fitness ribbon)
TradingView Resource Limits (Built-in Caps):
Max Bars Back: 500 (sufficient for WFO and evolution)
Max Labels: 100 (plenty for entry/exit markers)
Max Lines: 150 (adequate for stop/target lines)
Max Boxes: 50 (not heavily used)
Max Polylines: 100 (confidence halos)
Recommended Chart Settings:
Timeframe: 15min to 1H (optimal signal/noise balance)
5min: Works but noisier, more signals
4H/Daily: Works but fewer signals
Bars Loaded: 1000+ (ensures sufficient evolution history)
Replay Mode: Excellent for testing without risk
Performance Optimization Tips:
Disable gradient cloud if chart lags (most CPU intensive visual)
Disable fitness ribbon if still laggy
Reduce cloud layers from 7 to 3
Reduce ribbon layers from 10 to 5
Turn off diagnostics panel unless actively tuning
Close other heavy indicators to free resources
Browser/Platform Compatibility:
Works on all modern browsers (Chrome, Firefox, Safari, Edge)
Mobile app supported (full functionality on phone/tablet)
Desktop app supported (best performance)
Web version supported (may be slower on older computers)
Data Requirements:
Real-time or delayed data both work
No special data feeds required
Works with TradingView's standard data
Historical + live data seamlessly integrated
🎓 THEORETICAL FOUNDATIONS
AGE synthesizes advanced concepts from multiple disciplines:
Evolutionary Computation
Genetic Algorithms (Holland, 1975): Population-based optimization through natural selection metaphor
Tournament Selection: Fitness-based parent selection with diversity preservation
Crossover Operators: Fitness-weighted gene recombination from two parents
Mutation Operators: Random gene perturbation for exploration of new parameter space
Elitism: Preservation of top N performers to prevent loss of best solutions
Adaptive Parameters: Different mutation rates for historical vs. live phases
Technical Analysis
Support/Resistance: Price structure within swing ranges
Trend Following: EMA-based directional bias
Momentum Analysis: RSI, ROC, MACD composite indicators
Volatility Analysis: ATR-based risk scaling
Volume Confirmation: Trade activity validation
Information Theory
Shannon Entropy (1948): Quantification of market order vs. disorder
Signal-to-Noise Ratio: Directional information vs. random walk
Information Content: How much "information" a price move contains
Statistics & Probability
Walk-Forward Analysis: Rolling in-sample/out-of-sample optimization
Out-of-Sample Validation: Testing on unseen data to prevent overfitting
Monte Carlo Principles: Shadow portfolio simulation with realistic execution
Expectancy Theory: Win rate × avg win - loss rate × avg loss
Probability Distributions: Signal confidence quantification
Risk Management
ATR-Based Stops: Volatility-normalized risk per trade
Volatility Regime Detection: Market state classification (trending/choppy/volatile)
Drawdown Control: Peak-to-trough equity measurement
R-Multiple Normalization: Performance measurement in risk units
Machine Learning Concepts
Online Learning: Continuous adaptation as new data arrives
Fitness Functions: Multi-objective optimization (win rate + expectancy + drawdown)
Exploration vs. Exploitation: Balance between trying new strategies and using proven ones
Overfitting Prevention: Walk-forward validation as regularization
Novel Contribution:
AGE is the first TradingView indicator to apply genetic algorithms to real-time indicator parameter optimization while maintaining strict anti-overfitting controls through walk-forward validation.
Most "adaptive" indicators simply recalibrate lookback periods or thresholds. AGE evolves entirely new strategies through competitive selection - it's not parameter tuning, it's Darwinian evolution of trading logic itself.
The combination of:
Genetic algorithm population management
Shadow portfolio simulation for realistic fitness evaluation
Walk-forward validation to prevent overfitting
Multi-indicator confluence for signal quality
Dynamic volatility scaling for adaptive risk
...creates a system that genuinely learns and improves over time while avoiding the curse of curve-fitting that plagues most optimization approaches.
🏗️ DEVELOPMENT NOTES
This project represents months of intensive development, facing significant technical challenges:
Challenge 1: Making Genetics Actually Work
Early versions spawned garbage strategies that polluted the gene pool:
Random gene combinations produced nonsensical parameter sets
Weak strategies survived too long, dragging down population
No clear convergence toward optimal solutions
Solution:
Comprehensive fitness scoring (4 factors: win rate, P&L, expectancy, drawdown)
Elite preservation (top 2 always protected)
Walk-forward validation (unproven strategies penalized 30%)
Tournament selection (fitness-weighted breeding)
Adaptive culling (MAS decay creates increasing selection pressure)
Challenge 2: Balancing Evolution Speed vs. Stability
Too fast = population chaos, no convergence. Too slow = can't adapt to regime changes.
Solution:
Dual-phase timing: Fast evolution during historical (30/60 bar intervals), slow during live (200/400 bar intervals)
Adaptive mutation rates: 20% historical, 8% live
Spawn/cull ratio: Always 2:1 to prevent population collapse
Challenge 3: Shadow Portfolio Accuracy
Needed realistic trade simulation without lookahead bias:
Can't peek at future bars for exits
Must track multiple portfolios simultaneously
Stop/target checks must use bar's high/low correctly
Solution:
Entry on close (realistic)
Exit checks on current bar's high/low (realistic)
Independent position tracking per strategy
Cooldown periods to prevent unrealistic rapid re-entry
ATR-normalized P&L (R-multiples) for fair comparison across volatility regimes
Challenge 4: Pine Script Compilation Limits
Hit TradingView's execution limits multiple times:
Too many array operations
Too many variables
Too complex conditional logic
Solution:
Optimized data structures (single DNA array instead of 8 separate arrays)
Minimal visual overlays (only essential plots)
Efficient fitness calculations (vectorized where possible)
Strategic use of barstate.islast to minimize dashboard updates
Challenge 5: Walk-Forward Implementation
Standard WFO is difficult in Pine Script:
Can't easily "roll forward" through historical data
Can't re-optimize strategies mid-stream
Must work in real-time streaming environment
Solution:
Age-based phase detection (first 250 bars = training, next 75 = testing)
Separate metric tracking for train vs. test
Efficiency calculation at fixed interval (after test period completes)
Validation flag persists for strategy lifetime
Challenge 6: Signal Quality Control
Early versions generated too many signals with poor win rates:
Single indicators produced excessive noise
No trend alignment
No regime awareness
Instant entries on single-bar spikes
Solution:
Three-layer confluence system (entropy + momentum + structure)
Minimum 2-of-3 agreement requirement
Trend alignment checks (penalty for counter-trend)
Regime-based probability adjustments
Persistence requirements (signals must hold multiple bars)
Volume confirmation
Quality gate (probability + confluence thresholds)
The Result
A system that:
Truly evolves (not just parameter sweeps)
Truly validates (out-of-sample testing)
Truly adapts (ongoing competition and breeding)
Stays within TradingView's platform constraints
Provides institutional-quality signals
Maintains transparency (full metrics dashboard)
Development time: 3+ months of iterative refinement
Lines of code: ~1500 (highly optimized)
Test instruments: ES, NQ, EURUSD, BTCUSD, SPY, AAPL
Test timeframes: 5min, 15min, 1H, Daily
🎯 FINAL WORDS
The Adaptive Genesis Engine is not just another indicator - it's a living system that learns, adapts, and improves through the same principles that drive biological evolution. Every bar it observes adds to its experience. Every strategy it spawns explores new parameter combinations. Every strategy it culls removes weakness from the gene pool.
This is evolution in action on your charts.
You're not getting a static formula locked in time. You're getting a system that thinks , that competes , that survives through natural selection. The strongest strategies rise to the top. The weakest die. The gene pool improves generation after generation.
AGE doesn't claim to predict the future - it adapts to whatever the future brings. When markets shift from trending to choppy, from calm to volatile, from bullish to bearish - AGE evolves new strategies suited to the new regime.
Use it on any instrument. Any timeframe. Any market condition. AGE will adapt.
This indicator gives you the pure signal intelligence. How you choose to act on it - position sizing, risk management, execution discipline - that's your responsibility. AGE tells you when and how confident . You decide whether and how much .
Trust the process. Respect the evolution. Let Darwin work.
"In markets, as in nature, it is not the strongest strategies that survive, nor the most intelligent - but those most responsive to change."
Taking you to school. — Dskyz, Trade with insight. Trade with anticipation.
— Happy Holiday's

Luxy VWAP Magic - MTF Projection EngineThis indicator transforms the classic VWAP into a comprehensive trading system. Instead of switching between multiple indicators, you get everything in one place: multi-timeframe analysis, statistical bands, momentum detection, volume profiling, session tracking, and divergence signals.
What Makes This Different
Traditional VWAP indicators show a single line. This tool treats VWAP as a foundation for complete market analysis. The indicator automatically detects your asset type (stocks, crypto, forex, futures) and adjusts its behavior accordingly. Crypto traders get 24/7 session tracking. Stock traders get proper market hours handling. Everyone gets institutional-grade analytics.
Anchor Period Options
The anchor period determines when VWAP resets and recalculates. You have three categories of options:
Time-Based Anchors:
Session - Resets at market open. Best for intraday stock trading where you want fresh VWAP each day.
Day - Resets at midnight UTC. Standard option for most traders.
Week / Month / Quarter / Year - Longer reset periods for swing traders and position traders who want broader context.
Rolling Window Anchors:
Rolling 5D - A sliding 5-day window that never resets. Solves the Monday problem where weekly VWAP equals daily VWAP on first day of week.
Rolling 21D - Approximately one month of trading data in continuous calculation. Excellent for crypto and forex markets that trade 24/7 without clear session breaks.
Event-Based Anchors:
Dividends - Resets on ex-dividend dates. Track institutional cost basis from dividend events.
Splits - Resets on stock split dates. Useful for analyzing post-split trading behavior.
Earnings - Resets on earnings report dates. See where volume-weighted trading occurred since last quarterly report.
Standard Deviation Bands
Three sets of bands surround the main VWAP line:
Band 1 (Aqua) - Plus and minus one standard deviation. Approximately 68% of price action occurs within this range under normal distribution. Touches suggest minor extension.
Band 2 (Fuchsia) - Plus and minus two standard deviations. Only 5% of trading should occur outside this range statistically. Touches here indicate significant overextension and high probability of mean reversion.
Band 3 (Purple) - Plus and minus three standard deviations. Touches are rare (0.3% probability) and represent extreme conditions. Often marks climax moves or panic selling/buying.
Each band can be toggled independently. Most traders show Band 1 by default and add Band 2 and 3 for specific setups or volatile instruments.
Multi-Timeframe VWAP System
The MTF section plots previous period VWAPs as horizontal support and resistance levels:
Daily VWAP - Previous day's final VWAP value. Key intraday reference level.
Weekly VWAP - Previous week's final VWAP. Important for swing traders.
Monthly VWAP - Previous month's final VWAP. Institutional benchmark level.
Quarterly VWAP - Previous quarter's final VWAP. Major support/resistance for position traders.
Previous Day VWAP - Yesterday's closing VWAP specifically, separate from current daily calculation.
The Confluence Zone percentage setting determines how close multiple VWAPs must be to trigger a confluence alert. When two or more timeframe VWAPs converge within this threshold, you get a high-probability support/resistance zone.
Session VWAPs for Global Markets
For forex, crypto, and futures traders who operate in 24/7 markets, the indicator tracks three major global sessions:
Asia Session - UTC 21:00 to 08:00. Gold colored line. Typically lower volatility, range-bound action that sets overnight levels.
London Session - UTC 08:00 to 17:00. Orange colored line. Often determines daily direction with high volume European participation.
New York Session - UTC 13:00 to 22:00. Blue colored line. Highest volume session globally. Sharp directional moves common.
Previous session VWAP values display as horizontal lines when each session closes, acting as intraday support and resistance. The table shows which sessions are currently active with checkmarks.
On-Chart Labels and Signals
The indicator plots several types of labels directly on price action when significant events occur:
Volume Spike Labels
Fire when current bar volume exceeds configurable thresholds relative to both the previous bar and the 20-bar average. Default settings require 300% of previous bar AND 200% of average volume. Green labels indicate bullish candles. Red labels indicate bearish candles. These spikes often mark institutional entry points.
Momentum Shift Labels
Appear when VWAP acceleration changes direction. The Slowing label warns when an active trend loses steam, often preceding reversal. The Accelerating label confirms trend continuation or potential bottom during downtrends. Filters available to show only reversal signals in existing trends.
VWAP Squeeze Labels
Detect when standard deviation bands contract relative to ATR (Average True Range). Low volatility compression often precedes explosive breakout moves. When the squeeze fires (releases), a label appears with directional prediction based on VWAP slope.
Divergence Labels
Mark price/volume divergences using CVD (Cumulative Volume Delta) analysis:
Bullish divergence: Price makes lower low, but CVD makes higher low. Hidden accumulation despite price weakness.
Bearish divergence: Price makes higher high, but CVD makes lower high. Hidden distribution despite price strength.
Dynamic VWAP Coloring
The main VWAP line changes color based on its slope direction:
Green - VWAP is rising. Institutional buying pressure. Volume-weighted price increasing.
Red - VWAP is falling. Institutional selling pressure. Volume-weighted price decreasing.
Gray - VWAP is flat. Consolidation or balance between buyers and sellers.
This coloring can be disabled for a static blue line if you prefer cleaner visuals. The VWAP label next to the line shows the current trend direction and delta percentage.
Calculated Projection Cone
One of the most powerful features is the Calculated Projection Cone. Unlike traditional extrapolation methods that simply extend a trend line forward, this system analyzes what actually happened in similar market conditions throughout the chart's history.
How It Works:
The system classifies each bar into one of 27 unique market states:
Z-Score Level - LOW (oversold), MID (fair value), or HIGH (overbought) based on configurable thresholds
Trend Direction - DOWN, FLAT, or UP based on VWAP slope
Volume Profile - LOW (below 80%), NORMAL (80-150%), or HIGH (above 150%) relative volume
When you look at the current bar, the indicator:
1. Identifies the current market state (e.g., LOW Z-Score + UP Trend + HIGH Volume)
2. Searches through all historical bars on the chart that had the same state
3. Calculates what happened in those bars X bars later (where X is your projection horizon)
4. Shows you the probability of up/down and the average move size
Visual Elements:
Probability Cone - Colored green (bullish probability above 55%), red (bearish below 45%), or gold (neutral). The cone width represents the historical range of outcomes (roughly the 20th to 80th percentile).
Center Line - Shows the average expected price based on historical outcomes in similar conditions.
Probability Label - Displays direction probability and average move. Example: "67% UP (+0.8%)" means 67% of similar past cases moved up, averaging 0.8% gain.
Fallback System:
When the exact 27-state match has insufficient historical data:
First fallback: Uses Z-Score plus Trend only (9 broader states, ignoring volume)
Second fallback: Uses Z-Score only (3 states)
When fallback is active, confidence automatically adjusts
Settings:
Projection Horizon - How many bars forward to analyze outcomes (5, 10, 15, or 20 bars, default 10)
Lookback Period - Historical data window in days (30-252, default 60)
Minimum Samples - Cases needed before using fallback (5-30, default 10)
Z-Score Threshold - Bucket boundary for LOW/MID/HIGH classification (1.0, 1.5, or 2.0 sigma)
Cloud Transparency - Adjust visibility (50-95%)
Colors - Customize bullish, bearish, and neutral cone colors
Confidence Levels:
HIGH - 30 or more similar historical cases found
MEDIUM - 15-29 similar cases
LOW - Fewer than 15 cases (more uncertainty)
IMPORTANT DISCLAIMER:
The Calculated Projection is based on past patterns only. It is NOT a price prediction or financial advice. Similar market states in the past do not guarantee similar outcomes in the future. The probability shown is historical frequency, not a guarantee. Always combine with other analysis and never rely solely on projections for trading decisions.
Alert Conditions
The indicator includes over 20 pre-built alert conditions:
Price vs VWAP:
Price crosses above VWAP
Price crosses below VWAP
Band Touches:
Price touches plus or minus one sigma band
Price touches plus or minus two sigma band (extreme)
Price touches plus or minus three sigma band (very extreme)
Z-Score Extremes:
Z-Score crosses above plus two (overbought extreme)
Z-Score crosses below minus two (oversold extreme)
Momentum and Trend:
Momentum slowing
Momentum accelerating
Trend turns bullish/bearish/neutral
Volume:
Volume spike detected
CVD Direction:
Buyers take control
Sellers take control
High Probability Signals:
Bullish reversal signal (oversold plus accelerating momentum)
Bearish reversal signal (overbought plus slowing momentum)
MTF and Special:
MTF confluence zone entry
VWAP squeeze fired
Bullish/Bearish divergence detected
Any significant signal (catch-all)
All signals use confirmed bar data to prevent false alerts from incomplete candles.
Settings Overview
Settings are organized into logical groups:
VWAP Settings
Anchor Period selection
Show/Hide VWAP line
Dynamic coloring toggle
VWAP label visibility
Bands Visibility
Toggle each of three bands independently
Info Table
Show/Hide table
Table position (9 options)
Text size
Volume spike label settings with adjustable thresholds
Momentum label settings with filters
Signal labels limited to 5 most recent (auto-managed)
Probability engine lookback period
Multi-Timeframe VWAP
Enable/Disable MTF system
Show MTF in table
Show MTF lines on chart
Individual timeframe toggles
Confluence zone threshold
Squeeze detection toggle
Session VWAPs
Enable/Disable session tracking
Apply to all assets option
Show session labels
Divergence Detection
Enable/Disable divergence
Pivot lookback period
Show divergence labels
Calculated Projection
Enable/Disable projection cone
Projection horizon (5, 10, 15, or 20 bars)
Lookback period in days (30-252)
Minimum samples threshold
Z-Score classification threshold (1.0, 1.5, or 2.0 sigma)
Cloud transparency adjustment
Bullish, bearish, and neutral colors
The Info Table - Your Trading Dashboard
The right side of your chart displays a compact table with up to twelve metrics.
Row-by-Row Breakdown:
Asset and Period - Shows what the indicator detected (US Stock, Crypto, Forex, etc.) and your selected anchor period. The detection happens automatically based on exchange data, so VWAP resets and calculations match your actual trading instrument.
Delta Percentage - How far current price sits from VWAP, expressed as a percentage. Positive means price trades above fair value. Negative means below. Large delta values (beyond 1-2%) often precede mean reversion moves. Day traders watch this for overextension.
Z-Score - Statistical deviation from VWAP measured in standard deviations. Unlike raw delta, Z-Score accounts for volatility. A 2% move in a volatile biotech stock differs from 2% in a stable utility. Z-Score normalizes this. Values beyond plus or minus two sigma occur only 5% of the time statistically.
Trend Direction - Whether VWAP itself is rising, falling, or flat. Rising VWAP means the volume-weighted average price is increasing, which indicates institutional accumulation. Falling VWAP suggests distribution. This differs from price trend since it weights by volume.
Momentum State - Is the trend accelerating or slowing down? This measures the rate of change in VWAP slope. When an uptrend shows slowing momentum, it often precedes reversal. Accelerating momentum in a downtrend can signal capitulation and potential bottom.
Relative Volume - Current bar volume compared to the 20-bar average, shown as percentage. Values above 150% indicate above-average activity. Spikes above 200-300% often mark institutional involvement. Low volume (below 80%) warns of potential fake moves.
MTF Bias - Four checkmarks or X marks showing whether price sits above or below Daily, Weekly, Monthly, and Quarterly VWAP. Four checkmarks means strong bullish alignment across all timeframes. Four X marks indicates bearish alignment. Mixed readings suggest consolidation or transition.
Band Probabilities - Historical statistics showing how often price touched each standard deviation band over your lookback period. This helps you understand if mean reversion or trend following works better for your specific instrument.
Session Status - Which global trading sessions are currently active (Asia, London, New York). Shows checkmarks for active sessions. Important for forex and crypto traders who need to know when major liquidity windows open and close.
Divergence State - Whether the indicator detects bullish or bearish divergence between price and cumulative volume delta. Bullish divergence occurs when price makes lower lows but buying pressure (CVD) makes higher lows, suggesting hidden accumulation.
Confidence Score - A weighted composite of all factors displayed as a progress bar and percentage. Combines MTF alignment, Z-Score, trend direction, volume delta, momentum, and relative volume into a single 0-100 score. Higher scores indicate stronger conviction setups.
Calculated Projection - When the Projection Cone is enabled, shows the historical probability of price direction and expected move. For example: "▲ 67% (+0.8%)" means in similar market states historically, price moved up 67% of the time with an average gain of 0.8%. The system analyzes 27 unique market states based on Z-Score, Trend, and Volume conditions.
Recommended Use Cases
Day Trading Stocks:
Use Session anchor with Band 1 visible. Watch for price returning to VWAP after morning move. Volume spikes near VWAP often mark institutional accumulation zones.
Swing Trading:
Use Weekly or Rolling 21D anchor. Enable MTF lines for Daily and Weekly levels. Trade pullbacks to these levels in direction of MTF bias.
Crypto and Forex:
Enable Session VWAPs. Use Rolling anchors to avoid artificial resets. Monitor session transitions for breakout opportunities.
Mean Reversion:
Focus on Z-Score reaching plus or minus two. Add Band 2 visibility. Combine with slowing momentum for highest probability reversals.
Trend Following:
Watch MTF bias alignment. Four checkmarks plus accelerating momentum plus high volume confirms trend continuation setups.
Projection Planning:
Enable the Calculated Projection to see what happened historically in similar market conditions. Use 5-10 bars for intraday setups, 15-20 bars for swing trade planning. Focus on high probability readings (above 60%) with HIGH confidence (30 or more samples). The cone shows the probable range of outcomes based on actual historical data. Combine with other factors like MTF alignment and volume for higher conviction setups.
Important Notes
The indicator does not repaint. MTF values use previous period's confirmed data.
Rolling VWAP works best on 15-minute timeframes and above due to bar lookback requirements.
Session VWAPs apply to global markets by default (forex, crypto, futures). Enable the all-assets option for stocks if desired.
Volume data for forex represents tick volume, not actual traded volume.
All alert conditions fire only on confirmed (closed) bars to prevent false signals.
The Calculated Projection updates each bar as market state changes. This is expected behavior. The projection shows probabilities based on similar past conditions, not a fixed prediction.
Q AND A
Q: Does this indicator repaint?
A: No. The main VWAP calculation uses standard TradingView VWAP methodology. Multi-timeframe values use previous period's confirmed data with appropriate lookahead settings. All alert signals require bar confirmation.
Q: Why does my Rolling VWAP look different on 1-minute versus 15-minute charts?
A: Rolling VWAP calculates across a fixed number of trading days. On very short timeframes, the bar lookback may hit TradingView limits. For best Rolling VWAP accuracy, use 15-minute or higher timeframes.
Q: Can I use this on any instrument?
A: Yes. The indicator automatically detects asset type and adjusts behavior. Stocks use standard market hours. Crypto uses 24/7 calculations. Forex uses tick volume. Everything adapts automatically.
Q: What does the Confidence Score actually measure?
A: The score combines six weighted factors: MTF alignment (25%), Z-Score position (20%), Trend direction (20%), CVD pressure (15%), Momentum state (10%), and Relative volume (10%). Higher scores indicate more factors aligned in one direction.
Q: Why are Session VWAPs not showing on my stock chart?
A: Session VWAPs apply to 24-hour markets by default (forex, crypto, futures). For stocks, enable the Use for All Assets option in Session VWAP settings.
Q: The Divergence labels appear delayed. Is this a bug?
A: Divergence detection requires pivot confirmation, which needs bars on both sides of the pivot point. The label appears at the actual pivot location (several bars back) once confirmed. This is intentional and prevents false signals.
Q: Can I change the band colors?
A: Yes. Each of the three bands has its own color input setting. You can customize Band 1, Band 2, and Band 3 colors to match your preferences. The defaults are Aqua, Fuchsia, and Purple. The main VWAP line color adapts dynamically based on slope direction or can be set to static blue.
Q: How do I set up alerts?
A: Right-click on the chart, select Add Alert, choose this indicator, and select your desired condition from the dropdown. All conditions include descriptive alert messages with relevant data.
Q: What is the Probability Engine lookback period?
A: This setting determines how many trading days the indicator analyzes to calculate band touch rates and mean reversion statistics. Default is 60 days (approximately 3 months). Longer periods provide more stable statistics but may miss recent behavior changes.
Q: Why do I see fewer labels than expected?
A: Signal labels (Volume, Momentum, Squeeze, Divergence) are limited to 5 most recent labels on the chart to keep it clean. When a new label appears, the oldest one is automatically removed. Additionally, momentum labels have several filters: check the slope multiplier setting (higher values require stronger trends) and the Only Reversal Signals option (when enabled, labels only appear for potential reversals, not trend confirmations).
Q: What is the Calculated Projection and how accurate is it?
A: The Calculated Projection analyzes what happened in past market conditions similar to the current state. It classifies each bar by Z-Score level, Trend direction, and Volume profile (27 unique states), then shows the historical probability of up vs down and the average move size. It is NOT a price prediction or guarantee. The probability shown is how often similar conditions led to up/down moves historically, not a future guarantee. Always use it as one input among many.
Q: Why does the Projection probability change?
A: The projection updates on each bar as market state changes. If Z-Score moves from LOW to MID, or trend shifts from UP to FLAT, the system looks up a different historical category. This is expected behavior. The projection shows what happened in similar past conditions to the current bar's state.
Q: The Projection shows LOW confidence. What does that mean?
A: Confidence levels indicate sample size: HIGH means 30 or more historical cases found, MEDIUM means 15-29 cases, LOW means fewer than 15 cases. When sample size is low, the system uses a fallback: first aggregating by Z-Score plus Trend only (ignoring volume), then by Z-Score only. LOW confidence means less statistical reliability, so weight other factors more heavily in your decision.
Q: Why does the cone sometimes show 50/50 probability?
A: A 50/50 reading means that in similar past market states, price moved up roughly half the time and down half the time. This indicates a neutral or balanced condition where historical patterns provide no directional edge. Consider waiting for a higher probability setup or using other analysis methods.
CREDITS AND ACKNOWLEDGMENTS
Methodology Foundation:
VWAP (Volume Weighted Average Price) - Standard institutional benchmark calculation, widely used since the 1980s for algorithmic execution and fair value assessment
Standard Deviation Bands - Statistical volatility measurement applying normal distribution principles to price deviation from mean
Z-Score Analysis - Classic statistical normalization technique for comparing values across different volatility regimes
Cumulative Volume Delta (CVD) - Order flow analysis concept measuring aggressive buying versus selling pressure
Concept Integration:
Mean reversion probability engine - Custom historical statistics tracking for band touch rates
Momentum acceleration detection - Second derivative analysis of VWAP slope changes
VWAP Squeeze - Volatility compression concept adapted from TTM Squeeze methodology applied to VWAP bands versus ATR
Confidence scoring system - Weighted composite scoring combining multiple technical factors
Calculated Projection Cone - Probability-based projection using 27-state market classification (Z-Score, Trend, Volume) with historical outcome analysis and weighted fallback system
All calculations use standard public domain formulas and TradingView built-in functions. No proprietary third-party code was used.
For questions, feedback, or feature requests, please comment below or send a private message.
Happy Trading!

TraderDemircan - Ultimate Fibonacci Suite v2.0Ultimate Fibonacci Suite v2.0 - Advanced Harmonic Pattern Detection & XABCD Analysis
-Overview
The Ultimate Fibonacci Suite v2.0 is a comprehensive technical analysis tool that combines advanced Fibonacci retracement/extension levels with automatic harmonic pattern detection and XABCD formation analysis. This indicator is designed for traders who want to identify high-probability reversal zones using multiple confluence techniques.
-What Makes This Script Original?
This indicator goes beyond simple Fibonacci retracements by:
Automatic XABCD Formation Detection: Identifies complete X-A-B-C-D patterns in real-time, marking each critical point with precise Fibonacci relationships
Multi-Pattern Harmonic Recognition: Detects 5 major harmonic patterns (Gartley, Butterfly, Bat, Crab, Shark) with customizable tolerance levels
Confluence Zone Analysis: Automatically identifies areas where multiple Fibonacci levels converge, highlighting the strongest support/resistance zones
Integrated Risk Management: Calculates position sizing, stop-loss placement, and multiple take-profit targets based on pattern completion
Adaptive Mode Selection: Offers preset configurations for different trading styles (Scalper, Day Trader, Swing Trader)
-Key Features
Fibonacci Levels (15 levels available)
Standard retracement levels: 0.236, 0.382, 0.5, 0.618, 0.786
Extension levels: 1.272, 1.414, 1.618, 2.0, 2.618, 3.618, 4.236
All levels individually customizable with color and visibility options
Harmonic Pattern Detection
The indicator automatically identifies these harmonic patterns with their specific Fibonacci ratios:
Gartley Pattern (B: 0.618, D: 0.786) - 75% historical success rate
Butterfly Pattern (B: 0.786, D: 1.272-1.618) - 70% success rate
Bat Pattern (B: 0.382-0.5, D: 0.886) - 80% success rate
Crab Pattern (B: 0.382-0.618, D: 1.618) - 85% success rate
Shark Pattern (B: 0.382-0.618, D: 1.13-1.618) - 72% success rate
Each pattern displays its probability percentage and clearly marks the Potential Reversal Zone (PRZ).
XABCD Formation System
X Point: Initial swing low (0.0 level)
A Point: Peak of the move (1.0 level)
B Point: Retracement level (typically 0.382, 0.5, or 0.618)
C Point: Projected target for the corrective move
D Point (PRZ): The optimal entry zone for reversal trades
The system validates formations to ensure B point hasn't been violated and minimum swing size requirements are met.
Risk Management Tools
Automatic Stop-Loss Calculation: Placed below X point with buffer
Three Take-Profit Levels: TP1 (1.272), TP2 (1.618), TP3 (2.0) - all customizable
Position Size Calculator: Based on account size and risk percentage
Risk/Reward Ratio Display: Real-time R:R calculation for each setup
Confluence Zone Detection
Identifies areas where 2+ Fibonacci levels intersect within 0.5% price range
Highlights these zones with colored boxes
Customizable threshold for confluence detection (2-5 levels)
Trend Filter
Optional moving average filter (customizable period)
Can restrict pattern display to trend-aligned setups only
Visual trend indication on chart
-How It Works?
The indicator uses a sophisticated algorithm that:
Scans for Swing Points: Analyzes the last N bars (customizable 10-200) to identify significant swing lows and highs
Validates Swing Size: Filters out minor movements using a minimum swing size percentage threshold
Calculates Fibonacci Levels: Projects all retracement and extension levels from the identified X and A points
Monitors Price Action: Tracks current price to determine B point formation
Projects Targets: Calculates C and D targets based on the pattern's Fibonacci relationships
Pattern Recognition: Compares B retracement ratio against known harmonic pattern specifications
Risk Parameters: Automatically sets stop-loss and take-profit levels with position sizing
-Customization Options
Four Trading Modes:
Complete: All features enabled
Scalper: Optimized for short-term trades with tighter parameters
Day Trader: Balanced settings for intraday trading
Swing Trader: Longer-term focus with extended lookback periods
Display Settings:
Individual level visibility toggles
Custom colors for each Fibonacci level
Line style options (Solid, Dashed, Dotted)
Line thickness adjustment
Label display options (price/percentage/both)
Line extension controls (left/right/both)
Alert System:
Pattern completion alerts
C target achievement notifications
Key Fibonacci level breakout alerts
All alerts customizable on/off
-How to Use?
Apply the Indicator: Add to your chart and select your trading mode
Wait for Formation: The indicator will automatically detect valid XABCD formations
Identify Pattern Type: Check the pattern label to see which harmonic pattern is forming
Monitor Price Action: Watch for price to reach the D point (PRZ) - your potential entry zone
Execute Trade: Enter when price reaches D with:
Stop loss at the displayed SL level
Take profits at TP1, TP2, and TP3 levels
Use Confluence: Pay extra attention to setups where D point aligns with confluence zones
-Recommended Settings
For Scalping: Lookback 20-30 bars, Min Swing 0.5%, Tight TP levels
For Day Trading: Lookback 50 bars (default), Min Swing 1%, Standard TP levels
For Swing Trading: Lookback 100-150 bars, Min Swing 2%, Extended TP levels
Pattern Tolerance: 5% (default) - increase for more patterns, decrease for stricter detection
-Statistics Panel
Optional real-time statistics display showing:
Current pattern type and probability
Risk/reward ratio
Recommended position size
Distance to key levels
-Important Notes
This indicator does not repaint: All calculations are based on closed bars
Past performance is not indicative of future results: Use proper risk management
Best used with additional confirmation: Consider volume, trend context, and other indicators
Pattern completion does not guarantee reversal: Always use stop-losses
Optimized for trending markets: Works best when clear swings are present
-Technical Details
Pine Script Version: v6 (latest)
Overlay: Yes - plots directly on price chart
Max Lines/Labels/Boxes: 500 each
Calculation Method: Based on classical Fibonacci ratios and harmonic trading principles
No Repainting: All signals generated on bar close
-Educational Value
This indicator helps traders understand:
Fibonacci retracement/extension relationships
Harmonic pattern geometry and ratios
XABCD pattern structure
Confluence trading concepts
Risk management principles
-Who Is This For?
Traders familiar with Fibonacci analysis
Harmonic pattern traders
Price action traders looking for objective entry zones
Risk-conscious traders who want built-in money management
Anyone seeking to identify high-probability reversal zones

SMC Indicator by BadshahIntroduction
Unlock the hidden narrative of price action with this focused Smart Money Concepts (SMC) toolkit. Designed for precision and clarity, this indicator strips away chart noise to reveal the "skeleton" of the market. Whether you are tracking trend continuations or hunting for valid reversals, this tool automates the technical heavy lifting, allowing you to focus purely on execution.
How It Works
This script analyzes price action in real-time to map out two critical components of institutional trading:
1. Market Structure Architecture The indicator uses a rolling pivot algorithm to identify significant Highs and Lows based on your preferred sensitivity.
BOS (Break of Structure): Marks the confirmation of trend momentum. A solid line is drawn when price successfully closes beyond a structural pivot in the direction of the trend (e.g., breaking a high in an uptrend).
ChoCh (Change of Character): signals a potential shift in market sentiment. A dashed line appears when price violates a key swing point opposite to the prevailing trend, often the first sign of a reversal.
2. Liquidity Inefficiencies (FVG) The script scans every candle formation to detect Fair Value Gaps (Imbalances)—zones where aggressive buying or selling occurred without reciprocal trading.
Bullish Gaps: Highlighted when a candle's low fails to overlap with the high of the candle two periods prior.
Bearish Gaps: Highlighted when a candle's high fails to overlap with the low of the candle two periods prior.
These boxes extend forward, serving as high-probability "magnets" for price to revisit and rebalance.
Settings & Customization
Swing Length: Adjust the lookback period to tune the indicator for Scalping (lower values) or Swing Trading (higher values).
Visual Control: Toggle specific features (BOS, ChoCh, FVG) on or off and fully customize colors to blend with your chart theme.
Disclaimer
This indicator is strictly for analytical and educational purposes. It visualizes historical and real-time data but does not guarantee future market movements. Always manage your risk responsibly.
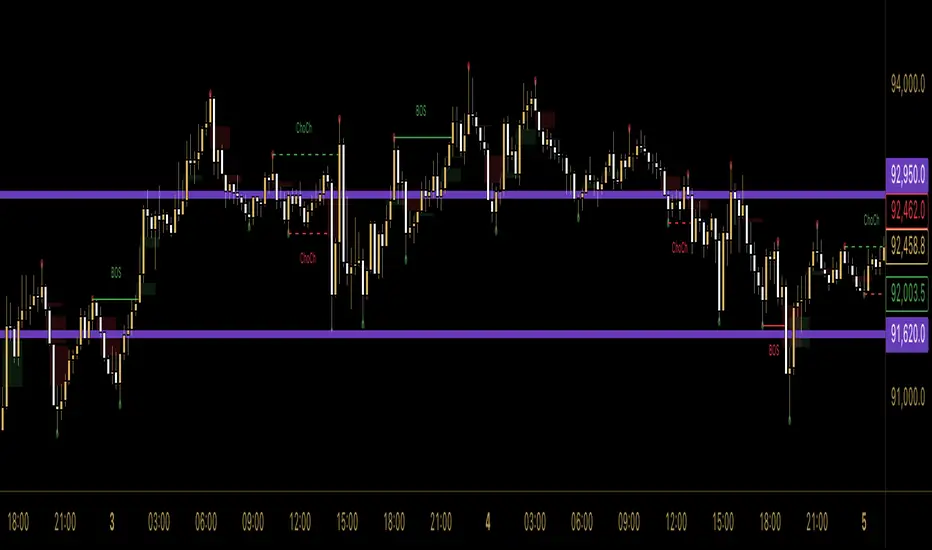
Pair Correlation Master [Macro]The Main Idea
Trading represents a constant battle between Systemic Flows (the whole market moving together) and Idiosyncratic Moves (one specific asset moving on its own).
This tool allows you to monitor a "basket" of 4 assets simultaneously (e.g., the major USD pairs). It answers the most important question in forex and multi-asset trading: "Is this move happening because the Dollar is weak, or because the Euro is strong?"
It separates the "Signal" (the unique move) from the "Noise" (the herd movement).
1. The Chart Lines: The "Race" (Macro Trend)
Think of the lines on your chart as a long-distance race. They visualize the performance of all 4 assets over the last 200 candles (adjustable).
- Bunched Together: If all lines are moving in the same direction, the market is highly correlated. (e.g., "The Dollar is selling off everywhere").
- Fanning Out: If the lines are spreading apart, specific currencies are outperforming others.
- The Zero Line: This is the starting line.
--- Above 0: The pair is in a macro uptrend.
--- Below 0: The pair is in a macro downtrend.
2. The Dashboard: The "Health Check" (Micro Data)
The table in the top right gives you the immediate statistics for right now.
- A. The Z-Score (The Rubber Band)
This measures how "stretched" price is compared to its normal behavior.
- White (< 2.0): Normal trading activity.
- Orange (> 2.0): The price is stretching. Warning sign.
- Red (> 3.0): Critical Stretch. The rubber band is pulled to its limit. Statistically, a pullback or pause is highly likely.
B. The Star (★)
The script automatically calculates the average behavior of your group. If one asset is behaving completely differently from the rest, it marks it with a Star (★).
- Example: EURUSD, GBPUSD, and NZDUSD are flat, but AUDUSD is rallying hard. AUDUSD gets the ★. This is where the unique opportunity lies.
🎯 Best Uses: 4H & Daily Timeframes
This indicator is tuned for "Macro" analysis. It works best on the "4-Hour" and "Daily" charts to filter out intraday noise and capture swing trading moves.
- Strategy 1: The "Rubber Band" Snap (Mean Reversion)
- Setup: Look for a Z-Score in the RED (> 3.0) on the Daily timeframe.
- Action: This indicates an unsustainable move. Look for reversals or exhaustion patterns to trade against the trend back toward the mean.
- Strategy 2: The "Lone Wolf" (Trend Following)
- Setup: Look for the asset with the Star (★).
- Action: If the whole basket is flat (Balanced), but the Star asset is breaking out, that creates a high-quality trend trade because that specific currency has its own catalyst (News/Earnings).
- Strategy 3: Systemic Flows (Basket Trading)
- Setup: The dashboard footer says "⚠️ SYSTEMIC MOVE."
- Action: This means everything is moving together (e.g., a massive USD crash). Don't look for unique setups; just join the trend on the strongest pair.
Dashboard Footer Key
The bottom of the table summarizes the current state of the market for you:
- Balanced / Rangebound: The market is quiet. Good for range trading.
- Focus: : Trade this specific pair. It is moving independently.
- Systemic Move: The whole basket is moving violently. Trade the momentum.
p.s. Suggestion - apply and use on the chart rather than an oscillator.

VPT Osc - Call/Put Mirror# 📊 VPT Oscillator with Call/Put Mirror & Trading Signals Dashboard
## Overview
Advanced **Volume Price Trend (VPT) Oscillator** specifically designed for **options traders** who want to analyze both CALL and PUT options simultaneously. This indicator provides real-time divergence detection, signal strength scoring, and mirror analysis to identify high-probability reversal and continuation setups.
## 🎯 What Makes This Unique?
### **Call/Put Mirror Technology**
- Automatically detects if you're viewing a CALL or PUT option
- Simultaneously plots the VPT of the opposite option (mirror)
- Identifies contrarian opportunities when current and mirror options show conflicting signals
- Perfect for options spreads and hedging strategies
### **Comprehensive Trading Signals Dashboard**
A real-time dashboard displays:
- **Active Signal** - Current divergence type (Regular/Hidden Bullish/Bearish)
- **Signal Score** - 0-100 probability rating based on multiple confirmation filters
- **Trade Action** - Clear BUY CALLS/PUTS recommendations
- **Position Size** - Risk-adjusted sizing based on signal strength
- **Mirror Analysis** - Opposite option's signal for contrarian plays
- **Volume & Change%** - Live price action data for both options
- **Risk Management** - Automatic stop-loss and target calculations
## 🔍 Key Features
### 1. **Four Divergence Types**
**Primary Entry Signals:**
- ✅ **Regular Bullish Divergence** - Price makes lower low, VPT makes higher low → BUY CALLS
- ✅ **Regular Bearish Divergence** - Price makes higher high, VPT makes lower high → BUY PUTS
**Advanced Continuation Signals:**
- 🔄 **Hidden Bullish Divergence** - Price makes higher low, VPT makes lower low → ADD TO CALLS
- 🔄 **Hidden Bearish Divergence** - Price makes lower high, VPT makes higher high → ADD TO PUTS
### 2. **Multi-Factor Signal Scoring System**
Each signal receives a score (0-100) based on:
- **Divergence Strength** (30 points) - Magnitude of price/volume divergence
- **Volume Confirmation** (20 points) - Above-average volume present
- **ADX Trend Filter** (20 points) - Strong trend confirmation
- **Multi-Timeframe Alignment** (20 points) - Higher timeframe agreement
- **RSI Extremes** (10 points) - Oversold/overbought confirmation
**Score Interpretation:**
- 90-100: Extremely Strong → Full position size (3-5% capital)
- 70-89: Strong → Standard position (2-3% capital)
- 50-69: Moderate → Half position (1% capital)
- <50: Weak → AVOID or paper trade only
### 3. **Zero Line Cross Strategy**
- 🚀 **Bullish Cross** - VPT crosses above zero → Mass buying pressure entering
- ⚠️ **Bearish Cross** - VPT crosses below zero → Distribution phase starting
- Best when combined with divergence signals (Score 70+)
### 4. **ATR Dynamic Bands**
Identifies extreme overbought/oversold conditions:
- **Upper Band Touch + Bearish Divergence (75+)** = 🔴 AGGRESSIVE PUT buying
- **Lower Band Touch + Bullish Divergence (75+)** = 🟢 AGGRESSIVE CALL buying
- Auto-adjusts to market volatility
### 5. **Contrarian Mirror Analysis**
🔥 **High Probability Reversals** detected when:
- Current option shows bearish divergence (Score 70+)
- Mirror option shows bullish divergence (Score 70+)
- Suggests sharp market reversal imminent
## 📈 Trading Strategies
### Strategy 1: Primary Divergence Entry
1. Wait for Regular Bullish/Bearish divergence
2. Confirm Score ≥ 70
3. Check volume confirmation (✓ Confirmed)
4. Enter with standard position size
5. Stop loss: Below recent swing low (for calls) / Above swing high (for puts)
6. Target: 2:1 to 3:1 risk-reward ratio
### Strategy 2: Hidden Divergence - Add to Winners
1. Already holding CALL/PUT position
2. Hidden divergence appears in same direction
3. Add to position during pullback/bounce
4. Lower risk (trend already established)
### Strategy 3: Mirror Contrarian Play
1. Current option shows bearish divergence
2. Mirror option shows strong bullish signal
3. Both scores ≥ 70
4. **EXIT current position → SWITCH to mirror option**
5. Captures sharp reversals
### Strategy 4: Zero Line Momentum
1. VPT crosses above/below zero line
2. Combine with Score 65+ divergence
3. Use ATM or slightly OTM options
4. Best for 1-3 day expiries (quick moves)
### Strategy 5: ATR Band Extremes
1. Wait for VPT to touch upper/lower band
2. Confirm with opposing divergence (Score 75+)
3. Enter aggressive position
4. Target: Return to zero line
## ⚙️ Customizable Settings
### Signal Filters
- **ADX Trend Filter** - Minimum ADX threshold for trend strength
- **Volume Confirmation** - Volume multiplier (1.2x default)
- **MTF Confirmation** - Higher timeframe alignment
- **Signal Cooldown** - Minimum bars between signals (prevents spam)
- **Minimum Score** - Filter signals below threshold
### Visual Options
- **ATR Dynamic Bands** - Show/hide volatility bands
- **Mirror Display** - Toggle mirror option VPT
- **Table Position** - 9 positions (top/middle/bottom × left/center/right)
- **Table Size** - Auto, Tiny, Small, Normal, Large, Huge
- **Risk Management Display** - Show/hide stop-loss and targets
### Divergence Detection
- **Pivot Lookback** - Sensitivity for divergence detection
- **Lookback Range** - Min/max bars for divergence confirmation
- **Individual Toggle** - Enable/disable each divergence type
## 📱 Dashboard Layout
**Top Rows (Critical Info):**
1. Mirror Signal & Score
2. Active Signal
3. Signal Score (0-100)
4. Zero Line Status
5. Volume Confirmation
6. Trade Action
**Middle Rows (Confirmations):**
7. Position Sizing
8. ADX Trend Strength
9. Higher Timeframe Alignment
10. ATR Band Status
**Bottom Rows (Risk Management):**
11. Contrarian Alert (if applicable)
12. Stop Loss Level
13. Target (R:R Ratio)
14. Expected Win Rate
## 🎨 Visual Elements
- **Color-coded VPT areas** - Aqua (bullish) / Orange (bearish)
- **Mirror VPT overlay** - Fuchsia (bull) / Yellow (bear) with transparency
- **Divergence lines** - Connect pivot points automatically
- **Score labels** - Show signal strength directly on chart
- **ATR bands** - Dynamic support/resistance zones
- **Background colors** - MTF trend confirmation (subtle)
## 💡 Best Practices
1. **Wait for Score ≥ 70** on primary signals for best win rate
2. **Always check volume confirmation** before entering
3. **Use mirror analysis** for additional edge
4. **Respect stop losses** - Options decay fast
5. **Consider expiry dates** - Minimum 5-7 days recommended
6. **Scale positions** based on score (90+ = full size)
7. **Watch zero line** for momentum shifts
## ⚠️ Risk Disclaimer
- This indicator is designed for **educational purposes** and analysis
- Options trading carries substantial risk of loss
- Past divergences do not guarantee future performance
- Always use proper position sizing (1-5% per trade recommended)
- Expected win rate ranges from 55-80% depending on score threshold
- Combine with fundamental analysis and broader market context
## 📊 Recommended Timeframes
- **Intraday Scalping:** 5min, 15min charts
- **Swing Trading:** 1H, 4H charts
- **Position Trading:** Daily charts
Works best on **liquid option contracts** with tight bid-ask spreads.
## 🔧 Technical Details
- Built on **Volume Price Trend (PVT)** oscillator
- Dual EMA crossover (Short: 3, Long: 20 default)
- Multi-factor scoring algorithm with weighted components
- Real-time mirror symbol parsing for NSE/exchange formats
- Dynamic ATR-based volatility bands
- Automatic pivot detection for divergences
## 📚 What You Get
✅ Professional-grade divergence detection
✅ Real-time signal scoring (0-100)
✅ Automatic mirror option analysis
✅ Trading signals dashboard
✅ Risk management calculator
✅ Volume and price change tracking
✅ Multiple confirmation filters
✅ Fully customizable settings
✅ Works on all option exchanges
***
**Perfect for:** Options traders, day traders, swing traders, divergence traders, volume analysis enthusiasts
**Works with:** CALL options, PUT options, Index options, Stock options, Futures options
**Supports:** NSE, NYSE, NASDAQ, and other major exchanges (auto-detects option format)
***
*If you find this indicator useful, please leave a comment or boost! Your feedback helps improve future versions.*
*For questions or feature requests, feel free to comment below.*
***
## 📝 Version History
**v1.0** - Initial Release
- Call/Put mirror functionality
- Four divergence types with scoring
- Trading signals dashboard
- ATR dynamic bands
- Zero line cross detection
- Volume and change% tracking
- Risk management module
***
**Tags:** #options #VPT #divergence #volumeanalysis #callput #tradingsignals #optionstrading #technicalanalysis #volumepricetrend

Advanced Delta Trading System ProAdvanced Delta Trading System Pro
Overview
This indicator is an advanced order flow analysis tool that combines Delta Volume Analysis, Cumulative Volume Delta (CVD), Multi-Timeframe Trend Confirmation, and Volume Profile Zones to identify high-probability trading opportunities based on institutional buying and selling pressure.
🔍 Core Concepts & Methodology
1. Range-Weighted Delta Calculation (Original Implementation)
Unlike basic delta indicators that simply subtract selling volume from buying volume, this script uses a range-weighted approach:
Range Weight = |Price Movement| / Candle Range
Bar Delta = Volume × Direction × Range Weight
Why this matters:
Accounts for intra-bar price action strength
Provides more accurate representation of directional conviction
Filters out low-conviction volume during ranging periods
2. Cumulative Volume Delta (CVD) with Momentum
The script calculates CVD by accumulating bar deltas and applies:
EMA smoothing to reduce noise (adjustable period)
Delta Momentum indicator: Measures the rate of change of delta relative to its average
CVD Slope detection: Identifies accumulation/distribution phases
Formula:
Delta Momentum = Current Absolute Delta / Average Absolute Delta
This normalized momentum metric helps filter low-conviction signals.
3. Multi-Timeframe CVD Confluence (Unique Feature)
The indicator pulls CVD trend data from a higher timeframe (default: 15min) to:
Confirm signals only when aligned with HTF institutional flow
Display HTF bias in the dashboard (Bull ▲ / Bear ▼ / Neutral)
Prevent counter-trend trades against larger timeframe momentum
Edge: Many delta indicators operate on single timeframes; this multi-timeframe approach significantly reduces false signals.
4. Volume Profile Zone Detection
Instead of static support/resistance, the script dynamically identifies:
High Volume Nodes (HVN): Areas with 1.5x above-average volume - potential magnets/reversal zones
Low Volume Nodes (LVN): Areas with <0.5x average volume - breakout zones with minimal resistance
These zones are visualized as semi-transparent boxes on the chart, updated in real-time.
5. Delta-CVD Divergence Detection
The script identifies:
Bullish Divergence: Price makes lower low while CVD makes higher low (accumulation)
Bearish Divergence: Price makes higher high while CVD makes lower high (distribution)
Uses pivot detection with adjustable lookback periods and draws divergence lines automatically.
🎯 Signal Generation Logic
Buy Signal Requirements:
Bar delta exceeds threshold (Average Delta × Imbalance Multiplier)
Delta momentum ≥ minimum threshold (default: 1.2)
CVD slope is positive (accumulation phase)
Higher timeframe CVD is bullish (if MTF enabled)
Candle closes green (price confirmation)
Sell Signal Requirements:
Same criteria but inverted for selling pressure.
Enhanced Signals:
Signals are strengthened when accompanied by divergences, combining immediate imbalance with underlying accumulation/distribution patterns.
📊 Visual Features
1. Intelligent Candle Coloring
Color intensity based on delta momentum (0-3 scale)
Lime: Strong buying | Red: Strong selling | Gray: Neutral
Helps quickly identify conviction behind price moves
2. Delta Labels
Optional labels showing exact delta values (in thousands for readability)
Adjustable frequency (every Nth bar)
Color-coded by strength
3. Real-Time Dashboard
Displays:
Current bar delta
Cumulative Volume Delta (CVD)
Delta momentum reading
Higher timeframe bias
Active signals and divergences
⚙️ Customization Options
Delta Settings:
CVD Smoothing: Controls EMA period for CVD line
Avg Delta Length: Lookback for delta average calculation
Delta Momentum Period: Smoothing for momentum indicator
Signal Filters:
Imbalance Multiplier: Threshold for signal generation (higher = fewer, stronger signals)
CVD Confluence: Require/disable CVD trend alignment
Min Momentum: Filter weak signals below threshold
Volume Zones:
Lookback Period: Bars analyzed for HVN/LVN detection
Max Zone Boxes: Limit visual clutter
Toggle HVN/LVN independently
Multi-Timeframe:
Select any higher timeframe for CVD analysis
HTF Bias Panel: Show/hide dashboard element
🔔 Alert Conditions
Long/Short Signals: Fires when all confluence conditions met
Divergence Alerts: Bullish/Bearish divergence detected
Extreme Momentum: Delta momentum exceeds 2.5× average
HTF Trend Change: Higher timeframe CVD reverses
💡 How to Use
For Scalping:
Use 1-5min charts with 15min HTF confirmation
Focus on extreme momentum alerts (>2.5×)
Enter on signals near HVN zones for better R:R
For Swing Trading:
Use 15min-1H charts with 4H HTF confirmation
Wait for divergences + signal confluence
Avoid LVN zones (price likely to slice through)
Volume Profile Strategy:
Buy at HVN support with bullish delta
Sell at HVN resistance with bearish delta
Target LVN zones for breakout trades
🆚 What Makes This Script Unique
Unlike standard delta indicators, this combines:
Range-weighted delta (more accurate than simple volume delta)
Multi-timeframe confirmation (institutional flow alignment)
Dynamic volume profile zones (not static S/R)
Momentum-filtered signals (reduces noise significantly)
Divergence integration (catches reversals early)
Compared to free alternatives: Most delta scripts show raw cumulative delta without momentum filtering, MTF analysis, or volume profile integration. This script provides a complete order flow analysis system in one indicator.
⚠️ Important Notes
Not a standalone system: Use with price action and market structure
Optimize settings per asset: Crypto needs different settings than forex/stocks
Higher timeframes = more reliable: Reduce noise on lower timeframes with longer smoothing
Volume quality matters: Works best on high-liquidity assets with accurate volume data
📈 Best Timeframes
Scalping: 1m-5m (with 15m HTF)
Day Trading: 5m-15m (with 1H HTF)
Swing Trading: 1H-4H (with D HTF)
This indicator is designed for traders who understand order flow concepts and want a comprehensive, multi-layered approach to delta analysis beyond basic cumulative volume delta indicators.

TMT EMA Bundle - Hitesh NimjeTMT EMA Bundle - Multi Timeframe EMA Indicator
Created by: Hitesh Nimje | Contact: 8087192915
Overview
The TMT EMA Bundle is a comprehensive multi-EMA indicator designed for traders who rely on multiple exponential moving averages for trend analysis and trading decisions. This powerful tool displays 10 essential EMAs on your chart, providing complete visibility of short, medium, and long-term trends.
Key Features
🔹 10 Essential EMAs Included:
• EMA 9 (Blue) - Ultra Short-term trend
• EMA 11 (Red) - Short-term momentum
• EMA 15 (Yellow) - Quick trend changes
• EMA 21 (Black) - Swing trading reference
• EMA 50 (Gray) - Medium-term bias
• EMA 51 (Orange) - Alternative medium-term
• EMA 55 (Brown) - Extended medium-term
• EMA 100 (Purple) - Long-term trend
• EMA 200 (Maroon) - Major support/resistance
• EMA 400 (Green) - Primary trend direction
🔹 Customizable Settings
• Source selection for each EMA (Open, High, Low, Close, HL2, HLC3, OHLC4)
• Independent length adjustment for each moving average
• Color-coded lines for easy identification
🔹 Professional Features
• Clean, overlay display on price charts
• Optimized performance with max limits set
• Compatible with all timeframes
• Works on all instruments (Forex, Stocks, Crypto, Commodities)
How to Use
1. Trend Identification: All EMAs aligned = Strong trend
2. Support/Resistance: EMAs act as dynamic support/resistance levels
3. Entry Signals: Price reactions at key EMAs
4. Trend Confirmation: EMA crossovers indicate potential trend changes
5. Risk Management: Use EMAs for stop-loss placement
Best Practices
• Use higher timeframes (1H, 4H, Daily) for clearer signals
• Combine with price action and volume analysis
• Watch for EMA clusters and divergences
• Consider trend strength by EMA separation
Perfect For
✓ Swing Traders
✓ Day Traders
✓ Trend Followers
✓ Scalpers (shorter timeframes)
✓ Position Traders
Technical Specifications
• Version: Pine Script v6
• Overlay: Yes
• Multi-timeframe compatible
• No repainting
• Lightweight and efficient
This indicator is part of the Thought Magic Trading collection, designed to provide professional-grade technical analysis tools for serious traders.
Happy Trading! 📈
TRADING DISCLAIMER
RISK WARNING
Trading involves substantial risk of loss and is not suitable for all investors. Past performance is not indicative of future results. You should carefully consider whether trading is suitable for you in light of your circumstances, knowledge, and financial resources.
NO FINANCIAL ADVICE
This indicator is provided for educational and informational purposes only. It does not constitute:
* Financial advice or investment recommendations
* Buy/sell signals or trading signals
* Professional investment advice
* Legal, tax, or accounting guidance
LIMITATIONS AND DISCLAIMERS
Technical Analysis Limitations
* Pivot points are mathematical calculations based on historical price data
* No guarantee of accuracy of price levels or calculations
* Markets can and do behave irrationally for extended periods
* Past performance does not guarantee future results
* Technical analysis should be used in conjunction with fundamental analysis
Data and Calculation Disclaimers
* Calculations are based on available price data at the time of calculation
* Data quality and availability may affect accuracy
* Pivot levels may differ when calculated on different timeframes
* Gaps and irregular market conditions may cause level failures
* Extended hours trading may affect intraday pivot calculations
Market Risks
* Extreme market volatility can invalidate all technical levels
* News events, economic announcements, and market manipulation can cause gaps
* Liquidity issues may prevent execution at calculated levels
* Currency fluctuations, inflation, and interest rate changes affect all levels
* Black swan events and market crashes cannot be predicted by technical analysis
USER RESPONSIBILITIES
Due Diligence
* You are solely responsible for your trading decisions
* Conduct your own research before using this indicator
* Verify calculations with multiple sources before trading
* Consider multiple timeframes and confirm levels with other technical tools
* Never rely solely on one indicator for trading decisions
Risk Management
* Always use proper risk management and position sizing
* Set appropriate stop-losses for all positions
* Never risk more than you can afford to lose
* Consider the inherent risks of leverage and margin trading
* Diversify your portfolio and trading strategies
Professional Consultation
* Consult with qualified financial advisors before trading
* Consider your tax obligations and legal requirements
* Understand the regulations in your jurisdiction
* Seek professional advice for complex trading strategies
LIMITATION OF LIABILITY
Indemnification
The creator and distributor of this indicator shall not be liable for:
* Any trading losses, whether direct or indirect
* Inaccurate or delayed price data
* System failures or technical malfunctions
* Loss of data or profits
* Interruption of service or connectivity issues
No Warranty
This indicator is provided "as is" without warranties of any kind:
* No guarantee of accuracy or completeness
* No warranty of uninterrupted or error-free operation
* No warranty of merchantability or fitness for a particular purpose
* The software may contain bugs or errors
Maximum Liability
In no event shall the liability exceed the purchase price (if any) paid for this indicator. This limitation applies regardless of the theory of liability, whether contract, tort, negligence, or otherwise.
REGULATORY COMPLIANCE
Jurisdiction-Specific Risks
* Regulations vary by country and region
* Some jurisdictions prohibit or restrict certain trading strategies
* Tax implications differ based on your location and trading frequency
* Commodity futures and options trading may have additional requirements
* Currency trading may be regulated differently than stock trading
Professional Trading
* If you are a professional trader, ensure compliance with all applicable regulations
* Adhere to fiduciary duties and best execution requirements
* Maintain required records and reporting
* Follow market abuse regulations and insider trading laws
TECHNICAL SPECIFICATIONS
Data Sources
* Calculations based on TradingView data feeds
* Data accuracy depends on broker and exchange reporting
* Historical data may be subject to adjustments and corrections
* Real-time data may have delays depending on data providers
Software Limitations
* Internet connectivity required for proper operation
* Software updates may change calculations or functionality
* TradingView platform dependencies may affect performance
* Third-party integrations may introduce additional risks
MONEY MANAGEMENT RECOMMENDATIONS
Conservative Approach
* Risk only 1-2% of capital per trade
* Use position sizing based on volatility
* Maintain adequate cash reserves
* Avoid over-leveraging accounts
Portfolio Management
* Diversify across multiple strategies
* Don't put all capital into one approach
* Regularly review and adjust trading strategies
* Maintain detailed trading records
FINAL LEGAL NOTICES
Acceptance of Terms
* By using this indicator, you acknowledge that you have read and understood this disclaimer
* You agree to assume all risks associated with trading
* You confirm that you are legally permitted to trade in your jurisdiction
Updates and Changes
* This disclaimer may be updated without notice
* Continued use constitutes acceptance of any changes
* It is your responsibility to stay informed of updates
Governing Law
* This disclaimer shall be governed by the laws of the jurisdiction where the indicator was created
* Any disputes shall be resolved in the appropriate courts
* Severability clause: If any part of this disclaimer is invalid, the remainder remains enforceable
REMEMBER: THERE ARE NO GUARANTEES IN TRADING. THE MAJORITY OF RETAIL TRADERS LOSE MONEY. TRADE AT YOUR OWN RISK.
Contact Information:
* Creator: Hitesh_Nimje
* Phone: Contact@8087192915
* Source: Thought Magic Trading
© HiteshNimje - All Rights Reserved
This disclaimer should be prominently displayed whenever the indicator is shared, sold, or distributed to ensure users are fully aware of the risks and limitations involved in trading.

Force Pulse█ OVERVIEW
Force Pulse is a fast-reacting oscillator that measures the internal strength of market sides by analyzing the aggregated dominance of bulls and bears based on candle size.
The indicator normalizes this difference into a 0–100 range, generates signals (OB/OS, midline cross, MA midline cross), and detects divergences between price and the oscillator.
It also offers advanced visualization, signal markers, and alerts, making it a versatile tool suitable for many trading styles.
█ CONCEPTS
Force Pulse was designed as a universal tool that can be applied to various trading strategies depending on its settings:
- increasing the period lengths and smoothing transforms it into a momentum/trend indicator, revealing a stable dominance of one market side.
- Lowering these parameters turns it into a peak/low detector, ideal for contrarian and mean-reversion strategies.
The oscillator analyzes the relationship between the sum of bullish and bearish candles over a selected period, based on:
- candle body size, or
- average candle body size (AVG Body).
Depending on the selected mode, OB/OS levels should be adjusted, as value dynamics differ between modes.
The output is normalized to 0–100, where:
> 50 – bullish dominance,
< 50 – bearish dominance.
The additional MA line is derived from smoothed oscillator values and serves as a signal line for midline crosses and as a trend filter.
The indicator also detects divergences (HL/LL) between price and the oscillator.
█ FEATURES
Bull & Bear Strength:
- Calculations are based on Body or AVG Body – mode selection requires adjusting OB/OS levels.
- Bullish and bearish candle values are summed separately.
- All results are normalized to the 0–100 scale.
Force Pulse Oscillator:
- The main line reflects the current dominance of either market side.
Dynamic colors:
- Green – above 50,
- Red – below 50.
Signal MA:
- SMA based on oscillator values functions as a signal line.
- Helps detect momentum shifts and generates signals via midline crosses.
- Can serve as a trend confirmation filter.
Overbought / Oversold:
- Configurable OB/OS levels, also for the MA line.
- Dynamic OB/OS line colors: when the MA line exceeds the defined threshold (e.g., MA > maOverbought or MA < maOversold), OB/OS lines change color (red/green).
- This often signals a potential reversal or correction and may act as additional confirmation for oscillator-generated signals.
Divergences:
- Detection based on swing pivots:
- Bullish: price LL, oscillator HL
- Bearish: price HH, oscillator LH
- Displayed as “Bull” / “Bear” labels.
Signals:
Supports multiple signal types:
- Overbought/Oversold Cross
- Midline Cross
- MA Midline Cross (based on the signal MA line)
- Signals appear as triangles above/below the oscillator.
Visualization:
- Gradient options for lines and levels.
- Full customization of colors, transparency, and line thickness.
Alerts available for:
- Divergences
- OB/OS crossings
- Midline crossings
- MA midline crossings
█ HOW TO USE
Add the indicator to your TradingView chart → Indicators → search “Force Pulse”
Parameter Configuration
Calculation Settings:
- Calculation Period (lookback) – defines the strength calculation window.
Force Mode (Body / AVG Body):
- Body – faster response, higher sensitivity.
- AVG Body – more stable output; adjust band levels and periods to your strategy.
- EMA Smoothing (smoothLen) – reduces oscillator noise.
- MA Length – length of the signal line (SMA).
Threshold Levels:
- Set Overbought/Oversold levels for both the oscillator and the MA line.
- Adjust levels depending on Body / AVG Body mode.
Divergence Detection:
- Enable/disable divergence detection.
- PivotLength affects both delay and signal quality.
- Signal Settings: Choose one or multiple signal types.
- Style & Colors: Full control over color schemes, gradients, and transparency.
Signal Interpretation
BUY:
- Oscillator leaves oversold (OS crossover).
- Midline cross upward.
- MA crosses the midline from below.
- Bullish divergence.
SELL:
- Oscillator leaves overbought (drops below OB).
- Midline cross downward.
- MA crosses the midline from above.
- Bearish divergence.
Trend / Momentum:
-Longer periods and stronger smoothing → stable directional signals.
-MA as a trend filter: e.g., signal line above the midline (50) and MA pointing upward indicates continuation of a bullish impulse.
Contrarian / Mean Reversion:
- Short periods → rapid detection of peaks and troughs; ideal for contrarian signals and pullback entries.
█ APPLICATIONS
- Trend Trading: Using midline and MA midline crosses to determine direction.
- Reversal Trading: OB/OS levels and divergences help identify reversals.
- Scalping & Intraday: Short settings + signal line above the midline with bullish MA → shows short-term impulse and continuation.
- Swing Trading: Longer MA and higher lookback provide a stable view of market-side dominance.
- Momentum Analysis: Force Pulse highlights the strength of the wave before price movement occurs.
█ NOTES
- In strong trends, the oscillator may stay in extreme zones for a long time — this reflects dominance, not necessarily a reversal signal.
- Divergences are more reliable on higher timeframes.
- OB/OS levels should be tailored to Body/AVG Body mode and the instrument.
- Best results come from combining the indicator with other tools (S/R, market structure, volume).

MTF Dashboard Table - Sachin ThakareOne Dashboard, Complete Market View!
By - Sachin Thakare (India, Mumbai)
MTF HUD Indicator - All-in-One Market Dashboard
📊 Basic Information
Indicator Name: MTF HUD Table - Bias Column
Created By: Sachin Thakare
Version: Pine Script v5
Type: Multi-Timeframe Heads-Up Display (HUD)
Category: Strategy/Utility Tool
🎯 What This Indicator Does
This is a comprehensive Multi-Timeframe Market Dashboard that displays key technical indicators across 8 different timeframes (3min to Monthly) in a single, easy-to-read table format. It helps traders quickly assess market bias and make informed decisions.
✨ Key Features
📈 Multi-Timeframe Analysis
8 Timeframes: 3m, 5m, 15m, 1H, 4H, Daily, Weekly, Monthly
Real-time Updates: All timeframes update simultaneously
Color-coded Signals: Instant visual feedback
🔢 Technical Indicators Included
Price Change & % Change - Immediate price movement
VWAP - Volume Weighted Average Price
EMA 9/21 - Exponential Moving Average crossover
200 MA - Long-term trend indicator
SuperTrend 10/3 - Trend-following indicator
RSI 9 - Momentum oscillator
MACD 8/21/5 - Moving Average Convergence Divergence
ADX 7/7 - Average Directional Index
Alligator - Bill Williams' trend indicator
Stochastic 5/3/3 - Overbought/Oversold levels
ATR 10 - Average True Range (volatility)
PH/PL - Previous Day High/Low position
🎨 Visual Design
Color Psychology:
🟢 Green: Strong Bullish
🟩 Light Green: Bullish
🔴 Red: Strong Bearish
🟥 Light Red: Bearish
⚪ Gray: Neutral
Customizable Position: Top/Bottom, Left/Right, Center
Clean Table Format: Professional HUD-style display
⚙️ Smart Features
Bias Column: Automatic market bias calculation
Score-based System: 11 indicators contribute to bias score
Customizable Thresholds: Adjust bull/bear levels
Multi-timeframe Security: Accurate timeframe calculations
🚀 How to Use
For Beginners:
Install the indicator on any chart
Look at the BIAS column for overall market direction
Check consistency across timeframes
Stronger signals when multiple timeframes agree
For Advanced Traders:
Identify confluence - When multiple indicators align
Timeframe alignment - Look for agreements across timeframes
Divergence spotting - When timeframes show conflicting signals
Entry/Exit points - Use with price action confirmation
Trading Strategies:
Trend Following: Follow the dominant bias across higher timeframes
Mean Reversion: Look for extreme readings in oscillator columns
Breakout Trading: Use PH/PL and ATR columns
Swing Trading: Focus on 4H and Daily timeframes
⚙️ Customization Settings
Position Settings:
Choose from 5 display positions
Adjust to your preferred chart layout
Indicator Parameters:
Adjust all indicator lengths and periods
Modify OB/OS levels for RSI and Stochastic
Change MA types (SMA/EMA) for 200 MA
Bias Thresholds:
Strong Bull Threshold: 8 (default)
Bull Threshold: 3 (default)
Bear Threshold: -3 (default)
Strong Bear Threshold: -8 (default)
💡 Pro Tips
Start with Higher Timeframes - Daily and Weekly first
Look for Alignment - Best trades when 3+ timeframes agree
Watch the BIAS Column - Quick market sentiment check
Combine with Price Action - Use support/resistance with signals
Risk Management - Never trade on indicator alone
⚠️ Important Notes
Not a Standalone System: Use with other analysis methods
Lagging Indicators: Most components are trend-following
Market Conditions: Works best in trending markets
Customize for Your Style: Adjust parameters for your trading style
🔄 Updates & Support
The indicator is regularly updated based on user feedback and market changes. For suggestions or issues, please leave a comment on the TradingView script page.
Perfect For: Day Traders, Swing Traders, Position Traders, Market Analysts, and anyone needing quick multi-timeframe analysis.
Best Results: When combined with fundamental analysis, risk management, and proper trading psychology.

Price Volume Heatmap [MHA Finverse]Price Volume Heatmap - Advanced Volume Profile Analysis
Unlock the power of institutional-level volume analysis with the Price Volume Heatmap indicator. This sophisticated tool visualizes market structure through volume distribution across price levels, helping you identify key support/resistance zones, high-probability reversal areas, and optimal entry/exit points.
🎯 What Makes This Indicator Unique?
Unlike traditional volume indicators that only show volume over time, this heatmap displays volume distribution across price levels , revealing where the most significant trading activity occurred. The gradient coloring system instantly highlights high-volume nodes (areas of strong interest) and low-volume nodes (potential breakout zones).
📊 Core Features
1. Dynamic Volume Heatmap
- Visualizes volume concentration across 250 customizable price levels
- Gradient color scheme from high volume (white) to low volume (teal/green)
- Adjustable brightness multiplier for enhanced contrast and clarity
- Real-time updates as market conditions evolve
2. Point of Control (POC)
- Automatically identifies the price level with the highest traded volume
- Acts as a magnetic price level where markets often return
- Critical for identifying fair value areas and potential reversal zones
- Customizable line style, width, and color
3. Flexible Lookback Settings
- Lookback Bars: Set any value from 1-5000 bars to control analysis depth
- Visible Range Mode: Analyze only what's currently visible on your chart
- Timeframe-Specific Settings: Different lookback periods for 1m, 5m, 15m, 30m, 1h, Daily, and Weekly charts
- Adapts to your trading style - scalping to position trading
4. Session Separation Analysis
- Tokyo Session: 00:00-09:00 UTC
- London Session: 07:00-16:00 UTC
- New York Session: 13:00-22:00 UTC
- Sydney Session: 21:00-06:00 UTC
- Daily Reset: Analyze each trading day independently
Session separation allows you to understand volume distribution specific to each major trading session, revealing institutional order flow patterns and session-specific support/resistance levels.
5. Profile Width Options
- Dynamic: Profile width adjusts based on lookback period
- Fixed Bars: Set a specific bar count for consistent profile width
- Extend Forward: Project the profile into future bars for planning trades
6. Smart Alerts
- POC crossover/crossunder alerts
- New session start notifications
- Never miss critical price action at high-volume nodes
📈 How to Use This Indicator Professionally
Understanding Market Structure:
High Volume Nodes (HVN):
- Appear as bright/white areas in the heatmap
- Represent price levels where significant trading occurred
- Act as strong support/resistance zones
- Markets often consolidate or bounce from these levels
- Trading Strategy: Look for entries when price tests HVN areas with confluence from other indicators
Low Volume Nodes (LVN):
- Appear as darker/teal areas in the heatmap
- Represent price levels with minimal trading activity
- Price tends to move quickly through these areas
- Often form "gaps" in the volume profile
- Trading Strategy: Expect rapid price movement through LVN zones; avoid placing stop losses here
Point of Control (POC):
- The single most important price level in your analysis window
- Represents the fairest price where maximum volume traded
- Price gravitates toward POC like a magnet
- Trading Strategy:
* When price is above POC: bullish bias, POC acts as support
* When price is below POC: bearish bias, POC acts as resistance
* POC breaks often lead to significant trend changes
Session-Based Analysis:
Use session separation to understand how different market participants trade:
Asian Session (Tokyo/Sydney):
- Typically lower volatility and range-bound
- Volume profiles often show tight, balanced distribution
- Use for identifying overnight ranges and gap fill zones
London Session:
- Highest volume session for forex pairs
- Often shows strong directional bias
- Look for breakouts from Asian ranges during London open
New York Session:
- Maximum participation when overlapping with London
- Institutional order flow most visible
- POC during NY session often becomes key level for following sessions
🎯 Practical Trading Applications
1. Identifying Support & Resistance:
High volume nodes from the heatmap are far more reliable than traditional swing highs/lows. When price approaches an HVN, expect reaction - either a bounce or a significant breakout if breached.
2. Trend Confirmation:
- Healthy uptrend: POC rising over time, HVN forming at higher levels
- Healthy downtrend: POC falling over time, HVN forming at lower levels
- Consolidation: POC relatively flat, volume balanced across range
3. Breakout Trading:
When price breaks through a Low Volume Node with momentum, it often continues to the next High Volume Node. Use LVN areas as measured move targets.
4. Reversal Zones:
Multiple HVN stacking on top of each other creates a "volume shelf" - an extremely strong support/resistance zone where reversals are highly probable.
5. Risk Management:
- Place stops beyond HVN areas (not within LVN zones)
- Size positions based on distance to nearest HVN
- Use POC as trailing stop level in trending markets
⚙️ Recommended Settings
For Day Trading (Scalping/Intraday):
- Lookback: 200-500 bars
- Rows: 200-250
- Enable session separation for your primary trading session
- Profile Width: Dynamic or Fixed Bars (30-50)
For Swing Trading:
- Lookback: 500-1000 bars
- Rows: 250
- Session separation: Daily Reset
- Profile Width: Dynamic
For Position Trading:
- Lookback: 1000-3000 bars
- Rows: 250
- Use timeframe-specific settings
- Profile Width: Extend Forward (20-50 bars)
💡 Pro Tips
1. Combine this indicator with price action analysis - volume confirms what price is telling you
2. Watch for POC convergence with other technical levels (fibonacci, pivot points, moving averages)
3. Volume at extremes (tops/bottoms of heatmap) often indicates exhaustion
4. Session POC from previous sessions often acts as magnet for current session
5. Increase brightness multiplier (1.5-2.5) for clearer visualization on busy charts
6. Use "Number of Sessions to Display" to analyze consistency of volume levels across multiple sessions
🎨 Customization
Fully customizable visual appearance:
- Gradient colors for volume visualization
- POC line thickness, color, and style
- Session line colors and visibility
- All settings organized in intuitive groups
⚠️ Disclaimer
This indicator is a technical analysis tool and should not be used as the sole basis for trading decisions. Always combine volume analysis with proper risk management, fundamental analysis, and other technical indicators. Past performance does not guarantee future results.
---
Support & Updates
Regular updates and improvements are made to enhance functionality. For questions, suggestions, or bug reports, please use the comments section below.
Happy Trading! 📊💹

Hash Pivot DetectorHash Pivot Detector
Professional Support & Resistance Detection with Multi-Timeframe Zone Analysis
Developed by Hash Capital Research, the Hash Pivot Detector is a sophisticated indicator designed for identifying key support and resistance levels using pivot-based detection with institutional-grade zone analysis.
Key Features
Zone-Based Detection
Unlike traditional single-line S/R indicators, Hash Pivot Detector uses configurable zones around pivot levels to represent realistic institutional order areas. Adjustable zone width accommodates different asset volatilities.
Multi-Timeframe Analysis
Displays higher timeframe support/resistance levels alongside current timeframe pivots, providing crucial context for institutional positioning and stronger price barriers.
Clean Visual Design
Features Hash Capital's signature fluorescent color scheme (pink resistance, cyan support) optimized for dark charts with high contrast and instant visual recognition. Semi-transparent zones keep your chart clean and readable.
How It Works
The indicator uses pivot high/low detection with configurable left and right bar parameters. When a pivot is confirmed, it plots:
Primary support/resistance lines at pivot levels
Semi-transparent zones representing realistic order areas
Higher timeframe S/R levels as crosses for additional context
Recommended Settings
For Swing Trading:
Pivot Bars: 10-20 left/right
Zone Width: 0.5-1.0%
HTF: Daily (on 1H-4H charts)
For Intraday Trading:
Pivot Bars: 5-10 left/right
Zone Width: 0.3-0.5%
HTF: 1H or 4H (on 5min-15min charts)
Asset-Specific Zone Width:
Forex/Crypto: 0.3-0.5%
Stocks: 0.5-1.0%
Volatile Assets: 1.0-2.0%
What Makes It Different
✓ Zone-based approach (more realistic than lines)
✓ Multi-timeframe confluence detection
✓ Minimal visual clutter with maximum information
✓ Professional institutional aesthetic
✓ Comprehensive tooltips for easy optimization
✓ No repainting - all pivots are confirmed
Best Used For
Identifying high-probability entry/exit zones
Setting stop-loss and take-profit levels
Recognizing breakout/breakdown areas
Multi-timeframe confluence analysis
Swing trading and position trading
Intraday scalping with adjusted parameters
Notes
Works on all timeframes and markets
Fully customizable colors and parameters
All settings include detailed optimization guidance
Clean code, efficient performance
No alerts or notifications (visual analysis only)

VMDM - Volume, Momentum & Divergence Master [BullByte]VMDM - Volume, Momentum and Divergence Master
Educational Multi-Layer Market Structure Analysis System
Multi-factor divergence engine that scores RSI momentum, volume pressure, and institutional footprints into one non-repainting confluence rating (0-100).
WHAT THIS INDICATOR IS
VMDM is an educational indicator designed to teach traders how to recognize high-probability reversal and continuation patterns by analyzing four independent market dimensions simultaneously. Instead of relying on a single indicator that may produce frequent false signals, VMDM creates a confluence-based scoring system that weights multiple confirmation factors, helping you understand which setups have stronger technical backing and which are lower quality.
This is NOT a trading system or signal generator. It is a learning tool that visualizes complex market structure concepts in an accessible format for both coders and non-coders.
THE PROBLEM IT SOLVES
Most traders face these common challenges:
Challenge 1 - Indicator Overload: Running RSI, volume analysis, and divergence detection separately creates chart clutter and conflicting signals. You waste time cross-referencing multiple windows trying to determine if all factors align.
Challenge 2 - False Divergences: Standard divergence indicators trigger on every minor pivot, creating noise. Many divergences fail because they lack supporting evidence from volume or market structure.
Challenge 3 - Missed Context: A bullish RSI divergence means nothing if it occurs during weak volume or in the middle of strong distribution. Context determines quality.
Challenge 4 - Repainting Confusion: Many divergence scripts repaint, showing perfect historical signals that never actually triggered in real-time, leading to false confidence.
Challenge 5 - Institutional Pattern Recognition: Absorption zones, stop hunts, and exhaustion patterns are taught in trading education but difficult to identify systematically without manual analysis.
VMDM addresses all five challenges by combining complementary analytical layers into one transparent, non-repainting, confluence-weighted system with visual clarity.
WHY THIS SPECIFIC COMBINATION - MASHUP JUSTIFICATION
This indicator is NOT a random mashup of popular indicators. Each of the four layers serves a specific analytical purpose and together they create a complete market structure assessment framework.
THE FOUR ANALYTICAL LAYERS
LAYER 1 - RSI MOMENTUM DIVERGENCE (Trend Exhaustion Detection)
Purpose: Identifies when price momentum is weakening before price itself reverses.
Why RSI: The Relative Strength Index measures momentum on a bounded 0-100 scale, making divergence detection mathematically consistent across all assets and timeframes. Unlike raw price oscillators, RSI normalizes momentum regardless of volatility regime.
How It Contributes: Divergence between price pivots and RSI pivots reveals early momentum exhaustion. A lower price low with a higher RSI low (bullish regular divergence) signals sellers are losing strength even as price makes new lows. This is the PRIMARY signal generator in VMDM.
Limitation If Used Alone: RSI divergence by itself produces many false signals because momentum can remain weak during continued trends. It needs confirmation from volume and structural evidence.
LAYER 2 - VOLUME PRESSURE ANALYSIS (Buying vs Selling Intensity)
Purpose: Quantifies whether the current bar's volume reflects buying pressure or selling pressure based on where price closed within the bar's range.
Methodology: Instead of just measuring volume size, VMDM calculates WHERE in the bar range the close occurred. A close near the high on high volume indicates strong buying absorption. A close near the low indicates selling pressure. The calculation accounts for wick size (wicks reduce pressure quality) and uses percentile ranking over a lookback period to normalize pressure strength on a 0-100 scale.
Formula Concept:
Buy Pressure = Volume × (Close - Low) / (High - Low) × Wick Quality Factor
Sell Pressure = Volume × (High - Close) / (High - Low) × Wick Quality Factor
Net Pressure = Buy Pressure - Sell Pressure
Pressure Strength = Percentile Rank of Net Pressure over lookback period
Why Percentile Ranking: Absolute volume varies by asset and session. Percentile ranking makes 85th percentile pressure on low-volume crypto comparable to 85th percentile pressure on high-volume forex.
How It Contributes: When a bullish divergence occurs at a pivot low AND pressure strength is above 60 (strong buying), this adds 25 confluence points. It confirms that the divergence is occurring during actual accumulation, not just weak selling.
Limitation If Used Alone: Pressure analysis shows current bar intensity but cannot identify trend exhaustion or reversal timing. High buying pressure can exist during a strong uptrend with no reversal imminent.
LAYER 3 - BEHAVIORAL FOOTPRINT PATTERNS (Volume Anomaly Detection)
CRITICAL DISCLAIMER: The terms "institutional footprint," "absorption," "stop hunt," and "exhaustion" used in this indicator are EDUCATIONAL LABELS for specific price and volume behavioral patterns. These patterns are detected through technical analysis of publicly available price, volume, and bar structure data. This indicator does NOT have access to actual institutional order flow, market maker data, broker stop-loss locations, or any non-public data source. These pattern names are used because they are common terminology in trading education to describe these technical behaviors. The analysis is interpretive and based on observable price action, not privileged information.
Purpose: Detect volume anomalies and price patterns that historically correlate with potential reversal zones or trend continuation failure.
Pattern Type 1 - Absorption (Labeled as "ACCUMULATION" or "DISTRIBUTION")
Detection Criteria: Volume is more than 2x the moving average AND bar range is less than 50 percent of the average bar range.
Interpretation: High volume compressed into a tight range suggests large participants are absorbing supply (accumulation) or distribution (distribution) without allowing price to move significantly. This often precedes directional moves once absorption completes.
Visual: Colored box zone highlighting the absorption area.
Pattern Type 2 - Stop Hunt (Labeled as "BULL HUNT" or "BEAR HUNT")
Detection Criteria: Price penetrates a recent 10-bar high or low by a small margin (0.2 percent), then closes back inside the range on above-average volume (1.5x+).
Interpretation: Price briefly spikes beyond recent structure (likely triggering stop losses placed just beyond obvious levels) then reverses. This is a classic false breakout pattern often seen before reversals.
Visual: Label at the wick extreme showing hunt direction.
Pattern Type 3 - Exhaustion (Labeled as "SELL EXHAUST" or "BUY EXHAUST")
Detection Criteria: Lower wick is more than 2.5x the body size with volume above 1.8x average and RSI below 35 (sell exhaustion), OR upper wick more than 2.5x body size with volume above 1.8x average and RSI above 65 (buy exhaustion).
Interpretation: Large wicks with high volume and extreme RSI suggest aggressive buying or selling was met with equally aggressive rejection. This exhaustion often marks short-term extremes.
Visual: Label showing exhaustion type.
How These Contribute: When a divergence forms at a pivot AND one of these behavioral patterns is active, the confluence score increases by 20 points. This confirms the divergence is occurring during structural anomaly activity, not just normal price flow.
Limitation If Used Alone: These patterns can occur mid-trend and do not indicate direction without momentum context. Absorption in a strong uptrend may just be continuation accumulation.
LAYER 4 - CONFLUENCE SCORING MATRIX (Quality Weighting System)
Purpose: Translate all detected conditions into a single 0-100 quality score so you can objectively compare setups.
Scoring Breakdown:
Divergence Present: +30 points (primary signal)
Pressure Confirmation: +25 points (volume supports direction)
Behavioral Footprint Active: +20 points (structural anomaly present)
RSI Extreme: +15 points (RSI below 30 or above 70 at pivot)
Volume Spike: +10 points (current volume above 1.5x average)
Maximum Possible Score: 100 points
Why These Weights: The weights reflect reliability hierarchy based on backtesting observation. Divergence is the core signal (30 points), but without volume confirmation (25 points) many fail. Behavioral patterns add meaningful context (20 points). RSI extremes and volume spikes are secondary confirmations (15 and 10 points).
Quality Tiers:
90-100: TEXTBOOK (all factors aligned)
75-89: HIGH QUALITY (strong confluence)
60-74: VALID (meets minimum threshold)
Below 60: DEVELOPING (not displayed unless threshold lowered)
How It Contributes: The confluence score allows you to filter noise. You can set your minimum quality threshold in settings. Higher thresholds (75+) show fewer but higher-quality patterns. Lower thresholds (50-60) show more patterns but include lower-confidence setups. This teaches you to distinguish strong setups from weak ones.
Limitation: Confluence scoring is historical observation-based, not predictive guarantee. A 95-point setup can still fail. The score represents technical alignment, not future certainty.
WHY THIS COMBINATION WORKS TOGETHER
Each layer addresses a limitation in the others:
RSI Divergence identifies WHEN momentum is exhausting (timing)
Volume Pressure confirms WHETHER the exhaustion is accompanied by opposite-side accumulation (confirmation)
Behavioral Footprint shows IF structural anomalies support the reversal hypothesis (context)
Confluence Scoring weights ALL factors into an objective quality metric (filtering)
Using only RSI divergence gives you timing without confirmation. Using only volume pressure gives you intensity without directional context. Using only pattern detection gives you anomalies without trend exhaustion context. Using all four together creates a complete analytical framework where each layer compensates for the others' weaknesses.
This is not a mashup for the sake of combining indicators. It is a structured analytical system where each component has a defined role in a multi-dimensional market assessment process.
HOW TO READ THE INDICATOR - VISUAL ELEMENTS GUIDE
VMDM displays up to five visual layer types. You can enable or disable each layer independently in settings under "Visual Layers."
VISUAL LAYER 1 - MARKET STRUCTURE (Pivot Points and Lines)
What You See:
Small labels at swing highs and lows marked "PH" (Pivot High) and "PL" (Pivot Low) with horizontal dashed lines extending right from each pivot.
What It Means:
These are CONFIRMED pivots, not real-time. A pivot low appears AFTER the required right-side confirmation bars pass (default 3 bars). This creates a delay but prevents repainting. The pivot only appears once it is mathematically confirmed.
The horizontal lines represent support (from pivot lows) and resistance (from pivot highs) levels where price previously found significant rejection.
Color Coding:
Green label and line: Pivot Low (potential support)
Red label and line: Pivot High (potential resistance)
How To Use:
These pivots are the foundation for divergence detection. Divergence is only calculated between confirmed pivots, ensuring all signals are non-repainting. The lines help you see historical structure levels.
VISUAL LAYER 2 - PRESSURE ZONES (Background Color)
What You See:
Subtle background color shading on bars - light green or light red tint.
What It Means:
This visualizes volume pressure strength in real-time.
Color Coding:
Light Green Background: Pressure Strength above 70 (strong buying pressure - price closing near highs on volume)
Light Red Background: Pressure Strength below 30 (strong selling pressure - price closing near lows on volume)
No Color: Neutral pressure (pressure between 30-70)
How To Use:
When a bullish divergence pattern appears during green pressure zones, it suggests the divergence is forming during accumulation. When a bearish divergence appears during red zones, distribution is occurring. Pressure zones help you filter divergences - those forming in supportive pressure environments have higher probability.
VISUAL LAYER 3 - DIVERGENCE LINES (Dotted Connectors)
What You See:
Dotted lines connecting two pivot points (either two pivot lows or two pivot highs).
What It Means:
A divergence has been detected between those two pivots. The line connects the price pivots where RSI showed opposite behavior.
Color Coding:
Bright Green Line: Bullish divergence (regular or hidden)
Bright Red Line: Bearish divergence (regular or hidden)
How To Use:
The divergence line appears ONLY after the second pivot is confirmed (delayed by right-side confirmation bars). This is intentional to prevent repainting. When you see the line appear, it means:
For Bullish Regular Divergence:
Price made a lower low (second pivot lower than first)
RSI made a higher low (RSI at second pivot higher than first)
Interpretation: Downtrend losing momentum
For Bullish Hidden Divergence:
Price made a higher low (second pivot higher than first)
RSI made a lower low (RSI at second pivot lower than first)
Interpretation: Uptrend continuation likely (pullback within uptrend)
For Bearish Regular Divergence:
Price made a higher high (second pivot higher than first)
RSI made a lower high (RSI at second pivot lower than first)
Interpretation: Uptrend losing momentum
For Bearish Hidden Divergence:
Price made a lower high (second pivot lower than first)
RSI made a higher high (RSI at second pivot higher than first)
Interpretation: Downtrend continuation likely (bounce within downtrend)
If "Show Consolidated Analysis Label" is disabled, a small label will appear on the divergence line showing the divergence type abbreviation.
VISUAL LAYER 4 - BEHAVIORAL FOOTPRINT MARKERS
What You See:
Boxes, labels, and markers at specific bars showing pattern detection.
ABSORPTION ZONES (Boxes):
Colored rectangular boxes spanning one or more bars.
Purple Box: Accumulation absorption zone (high volume, tight range, bullish close)
Red Box: Distribution absorption zone (high volume, tight range, bearish close)
If absorption continues for multiple consecutive bars, the box extends and a counter appears in the label showing how many bars the absorption lasted.
What It Means: Large volume is being absorbed without significant price movement. This often precedes directional breakouts once the absorption phase completes.
STOP HUNT MARKERS (Labels):
Small labels below or above wicks labeled "BULL HUNT" or "BEAR HUNT" (may show bar count if consecutive).
What It Means:
BULL HUNT : Price spiked below recent lows then reversed back up on volume - likely triggered sell stops before reversing
BEAR HUNT : Price spiked above recent highs then reversed back down on volume - likely triggered buy stops before reversing
EXHAUSTION MARKERS (Labels):
Labels showing "SELL EXHAUST" or "BUY EXHAUST."
What It Means:
SELL EXHAUST : Large lower wick with high volume and low RSI - aggressive selling met with strong rejection
BUY EXHAUST : Large upper wick with high volume and high RSI - aggressive buying met with strong rejection
How To Use:
These markers help you identify WHERE structural anomalies occurred. When a divergence signal appears AT THE SAME TIME as one of these patterns, the confluence score increases. You are looking for alignment - divergence + behavioral pattern + pressure confirmation = high-quality setup.
VISUAL LAYER 5 - CONSOLIDATED ANALYSIS LABEL (Main Pattern Signal)
What You See:
A large label appearing at pivot points (or in real-time mode, at current bar) containing full pattern analysis.
Label Appearance:
Depending on your "Use Compact Label Format" setting:
COMPACT MODE (Single Line):
Example: "BULLISH REGULAR | Q:HIGH QUALITY C:82"
Breakdown:
BULLISH REGULAR: Divergence type detected
Q:HIGH QUALITY: Pattern quality tier
C:82: Confluence score (82 out of 100)
FULL MODE (Multi-Line Detailed):
Example:
PATTERN DETECTED
-------------------
BULLISH REGULAR
Quality: HIGH QUALITY
Price: Lower Low
Momentum: Higher Low
Signal: Weakening Downtrend
CONFLUENCE: 82/100
-------------------
Divergence: 30
Pressure: 25
Institutional: 20
RSI Extreme: 0
Volume: 10
Breakdown:
Top section: Pattern type and quality
Middle section: Divergence explanation (what price did vs what RSI did)
Bottom section: Confluence score with itemized breakdown showing which factors contributed
Label Position:
In Confirmed modes: Label appears AT the pivot point (delayed by confirmation bars)
In Real-time mode: Label appears at current bar as conditions develop
Label Color:
Gold: Textbook quality (90+ confluence)
Green: High quality (75-89 confluence)
Blue: Valid quality (60-74 confluence)
How To Use:
This is your primary decision-making label. When it appears:
Check the divergence type (regular divergences are reversal signals, hidden divergences are continuation signals)
Review the quality tier (textbook and high quality have better historical win rates)
Examine the confluence breakdown to see which factors are present and which are missing
Look at the chart context (trend, support/resistance, timeframe)
Use this information to assess whether the setup aligns with your strategy
The label does NOT tell you to buy or sell. It tells you a technical pattern has formed and provides the quality assessment. Your trading decision must incorporate risk management, market context, and your strategy rules.
UNDERSTANDING THE THREE DETECTION MODES
VMDM offers three signal detection modes in settings to accommodate different trading styles and learning objectives.
MODE 1: "Confluence Only (Real-Time)"
How It Works: Displays signals AS THEY DEVELOP on the current bar without waiting for pivot confirmation. The system calculates confluence score from pressure, volume, RSI extremes, and behavioral patterns. Divergence signals are NOT required in this mode.
Delay: ZERO - signals appear immediately.
Use Case: Real-time scanning for high-confluence zones without divergence requirement. Useful for intraday traders who want immediate alerts when multiple factors align.
Tradeoff: More frequent signals but includes setups without confirmed divergence. Higher false signal rate. Signals can change as the bar develops (not repainting in historical bars, but current bar updates).
Visual Behavior: Labels appear at the current bar. No divergence lines unless divergence happens to be present.
MODE 2: "Divergence + Confluence (Confirmed)" - DEFAULT RECOMMENDED
How It Works: Full system engagement. Signals appear ONLY when:
A pivot is confirmed (requires right-side confirmation bars to pass)
Divergence is detected between current pivot and previous pivot
Total confluence score meets or exceeds your minimum threshold
Delay: Equal to your "Pivot Right Bars" setting (default 3 bars). This means signals appear 3 bars AFTER the actual pivot formed.
Use Case: Highest-quality, non-repainting signals for swing traders and learners who want to study confirmed pattern completion.
Tradeoff: Delayed signals. You will not receive the signal until confirmation occurs. In fast-moving markets, price may have already moved significantly by the time the signal appears.
Visual Behavior: Labels appear at the historical pivot location (in the past). Divergence lines connect the two pivots. This is the most educational mode because it shows completed, confirmed patterns.
Non-Repainting Guarantee: Yes. Once a signal appears, it never disappears or changes.
MODE 3: "Divergence + Confluence (Relaxed)"
How It Works: Same as Confirmed mode but with adaptive thresholds. If confluence is very high (10 points above threshold), the signal may appear even if some factors are weak. If divergence is present but confluence is slightly below threshold (within 10 points), it may still appear.
Delay: Same as Confirmed mode (right-side confirmation bars).
Use Case: Slightly more signals than Confirmed mode for traders willing to accept near-threshold setups.
Tradeoff: More signals but lower average quality than Confirmed mode.
Visual Behavior: Same as Confirmed mode.
DASHBOARD GUIDE - READING THE METRICS
The dashboard appears in the corner of your chart (position selectable in settings) and provides real-time market state analysis.
You can choose between four dashboard detail levels in settings: Off, Compact, Optimized (default), Full.
DASHBOARD ROW EXPLANATIONS
ROW 1 - Header Information
Left: Current symbol and timeframe
Center: "VMDM "
Right: Version number
ROW 2 - Mode and Delay
Shows which detection mode you are using and the signal delay.
Example: "CONFIRMED | Delay: 3 bars"
This reminds you that signals in confirmed mode appear 3 bars after the pivot forms.
ROW 3 - Market Regime
Format: "TREND UP HV" or "RANGING NV"
First Part - Trend State:
TREND UP: 20 EMA above 50 EMA with strong separation
TREND DOWN: 20 EMA below 50 EMA with strong separation
RANGING: EMAs close together, low trend strength
TRANSITION: Between trending and ranging states
Second Part - Volatility State:
HV: High Volatility (current ATR more than 1.3x the 50-bar average ATR)
NV: Normal Volatility (current ATR between 0.7x and 1.3x average)
LV: Low Volatility (current ATR less than 0.7x average)
Third Column: Volatility ratio (example: "1.45x" means current ATR is 1.45 times normal)
How To Use: Regime context helps you interpret signals. Reversal divergences are more reliable in ranging or transitional regimes. Continuation divergences (hidden) are more reliable in trending regimes. High volatility means wider stops may be needed.
ROW 4 - Pressure
Shows current volume pressure state.
Format: "BUYING | ██████████░░░░░░░░░"
States:
BUYING : Pressure strength above 60 (closes near highs)
SELLING : Pressure strength below 40 (closes near lows)
NEUTRAL : Pressure strength between 40-60
Bar Visualization: Each block represents 10 percentile points. A full bar (10 filled blocks) = 100th percentile pressure.
Color: Green for buying, red for selling, gray for neutral.
How To Use: When pressure aligns with divergence direction (bullish divergence during buying pressure), confluence is stronger.
ROW 5 - Volume and RSI
Format: "1.8x | RSI 68 | OB"
First Value: Current volume ratio (1.8x = volume is 1.8 times the moving average)
Second Value: Current RSI reading
Third Value: RSI state
OB: Overbought (RSI above 70)
OS: Oversold (RSI below 30)
Blank: Neutral RSI
How To Use: Volume spikes (above 1.5x) during divergence formation add confluence. RSI extremes at pivots add confluence.
ROW 6 - Behavioral Footprint
Format: "BULL HUNT | 2 bars"
Shows the most recent behavioral pattern detected and how long ago.
States:
ACCUMULATION / DISTRIBUTION: Absorption detected
BULL HUNT / BEAR HUNT: Stop hunt detected
SELL EXHAUST / BUY EXHAUST: Exhaustion detected
SCANNING: No recent pattern
NOW: Pattern is active on current bar
How To Use: When footprint activity is recent (within 50 bars) or active now, it adds context to divergence signals forming in that area.
ROW 7 - Current Pattern
Shows the divergence type currently detected (if any).
Examples: "BULLISH REGULAR", "BEARISH HIDDEN", "Scanning..."
Quality: Shows pattern quality (TEXTBOOK, HIGH QUALITY, VALID)
How To Use: This tells you what type of signal is active. Regular divergences are reversal setups. Hidden divergences are continuation setups.
ROW 8 - Session Summary
Format: "14 events | A3 H8 E3"
First Value: Total institutional events this session
Breakdown:
A: Absorption events
H: Stop hunt events
E: Exhaustion events
How To Use: High event counts suggest an active, volatile session with frequent structural anomalies. Low counts suggest quiet, orderly price action.
ROW 9 - Confluence Score (Optimized/Full mode only)
Format: "78/100 | ████████░░"
Shows current real-time confluence score even if no pattern is confirmed yet.
How To Use: Watch this in real-time to see how close you are to pattern formation. When it exceeds your threshold and divergence forms, a signal will appear (after confirmation delay).
ROW 10 - Patterns Studied (Optimized/Full mode only)
Format: "47 patterns | 12 bars ago"
First Value: Total confirmed patterns detected since chart loaded
Second Value: How many bars since the last confirmed pattern appeared
How To Use: Helps you understand pattern frequency on your selected symbol and timeframe. If many bars have passed since last pattern, market may be trending without reversal opportunities.
ROW 11 - Bull/Bear Ratio (Optimized/Full mode only)
Format: "28:19 | BULL"
Shows count of bullish vs bearish patterns detected.
Balance:
BULL: More bullish patterns detected (suggests market has had more bullish reversals/continuations)
BEAR: More bearish patterns detected
BAL: Equal counts
How To Use: Extreme imbalances can indicate directional bias in the studied period. A heavily bullish ratio in a downtrend might suggest frequent failed rallies (bearish continuation). Context matters.
ROW 12 - Volume Ratio Detail (Optimized/Full mode only)
Shows current volume vs average volume in absolute terms.
Example: "1.4x | 45230 / 32300"
How To Use: Confirms whether current activity is above or below normal.
ROW 13 - Last Institutional Event (Full mode only)
Shows the most recent institutional pattern type and how many bars ago it occurred.
Example: "DISTRIBUTION | 23 bars"
How To Use: Tracks recency of last anomaly for context.
SETTINGS GUIDE - EVERY PARAMETER EXPLAINED
PERFORMANCE SECTION
Enable All Visuals (Master Toggle)
Default: ON
What It Does: Master kill switch for ALL visual elements (labels, lines, boxes, background colors, dashboard). When OFF, only plot outputs remain (invisible unless you open data window).
When To Change: Turn OFF on mobile devices, 1-second charts, or slow computers to improve performance. You can still receive alerts even with visuals disabled.
Impact: Dramatic performance improvement when OFF, but you lose all visual feedback.
Maximum Object History
Default: 50 | Range: 10-100
What It Does: Limits how many of each object type (labels, lines, boxes) are kept in memory. Older objects beyond this limit are deleted.
When To Change: Lower to 20-30 on fast timeframes (1-minute charts) to prevent slowdown. Increase to 100 on daily charts if you want more historical pattern visibility.
Impact: Lower values = better performance but less historical visibility. Higher values = more history visible but potential slowdown on fast timeframes.
Alert Cooldown (Bars)
Default: 5 | Range: 1-50
What It Does: Minimum number of bars that must pass before another alert of the same type can fire. Prevents alert spam when multiple patterns form in quick succession.
When To Change: Increase to 20+ on 1-minute charts to reduce noise. Decrease to 1-2 on daily charts if you want every pattern alerted.
Impact: Higher cooldown = fewer alerts. Lower cooldown = more alerts.
USER EXPERIENCE SECTION
Show Enhanced Tooltips
Default: ON
What It Does: Enables detailed hover-over tooltips on labels and visual elements.
When To Change: Turn OFF if you encounter Pine Script compilation errors related to tooltip arguments (rare, platform-specific issue).
Impact: Minimal. Just adds helpful hover text.
MARKET STRUCTURE DETECTION SECTION
Pivot Left Bars
Default: 3 | Range: 2-10
What It Does: Number of bars to the LEFT of the center bar that must be higher (for pivot low) or lower (for pivot high) than the center bar for a pivot to be valid.
Example: With value 3, a pivot low requires the center bar's low to be lower than the 3 bars to its left.
When To Change:
Increase to 5-7 on noisy timeframes (1-minute charts) to filter insignificant pivots
Decrease to 2 on slow timeframes (daily charts) to catch more pivots
Impact: Higher values = fewer, more significant pivots = fewer signals. Lower values = more frequent pivots = more signals but more noise.
Pivot Right Bars
Default: 3 | Range: 2-10
What It Does: Number of bars to the RIGHT of the center bar that must pass for confirmation. This creates the non-repainting delay.
Example: With value 3, a pivot is confirmed 3 bars AFTER it forms.
When To Change:
Increase to 5-7 for slower, more confirmed signals (better for swing trading)
Decrease to 2 for faster signals (better for intraday, but still non-repainting)
Impact: Higher values = longer delay but more reliable confirmation. Lower values = faster signals but less confirmation. This setting directly controls your signal delay in Confirmed and Relaxed modes.
Minimum Confluence Score
Default: 60 | Range: 40-95
What It Does: The threshold score required for a pattern to be displayed. Patterns with confluence scores below this threshold are not shown.
When To Change:
Increase to 75+ if you only want high-quality textbook setups (fewer signals)
Decrease to 50-55 if you want to see more developing patterns (more signals, lower average quality)
Impact: This is your primary signal filter. Higher threshold = fewer, higher-quality signals. Lower threshold = more signals but includes weaker setups. Recommended starting point is 60-65.
TECHNICAL PERIODS SECTION
RSI Period
Default: 14 | Range: 5-50
What It Does: Lookback period for RSI calculation.
When To Change:
Decrease to 9-10 for faster, more sensitive RSI that detects shorter-term momentum changes
Increase to 21-28 for slower, smoother RSI that filters noise
Impact: Lower values make RSI more volatile (more frequent extremes and divergences). Higher values make RSI smoother (fewer but more significant divergences). 14 is industry standard.
Volume Moving Average Period
Default: 20 | Range: 10-200
What It Does: Lookback period for calculating average volume. Current volume is compared to this average to determine volume ratio.
When To Change:
Decrease to 10-14 for shorter-term volume comparison (more sensitive to recent volume changes)
Increase to 50-100 for longer-term volume comparison (smoother, less sensitive)
Impact: Lower values make volume ratio more volatile. Higher values make it more stable. 20 is standard.
ATR Period
Default: 14 | Range: 5-100
What It Does: Lookback period for Average True Range calculation used for volatility measurement and label positioning.
When To Change: Rarely needs adjustment. Use 7-10 for faster volatility response, 21-28 for slower.
Impact: Affects volatility ratio calculation and visual label spacing. Minimal impact on signals.
Pressure Percentile Lookback
Default: 50 | Range: 10-300
What It Does: Lookback period for calculating volume pressure percentile ranking. Your current pressure is ranked against the pressure of the last X bars.
When To Change:
Decrease to 20-30 for shorter-term pressure context (more responsive to recent changes)
Increase to 100-200 for longer-term pressure context (smoother rankings)
Impact: Lower values make pressure strength more sensitive to recent bars. Higher values provide more stable, long-term pressure assessment. Capped at 300 for performance reasons.
SIGNAL DETECTION SECTION
Signal Detection Mode
Default: "Divergence + Confluence (Confirmed)"
Options:
Confluence Only (Real-time)
Divergence + Confluence (Confirmed)
Divergence + Confluence (Relaxed)
What It Does: Selects which detection logic mode to use (see "Understanding The Three Detection Modes" section above).
When To Change: Use Confirmed for learning and non-repainting signals. Use Real-time for live scanning without divergence requirement. Use Relaxed for slightly more signals than Confirmed.
Impact: Fundamentally changes when and how signals appear.
VISUAL LAYERS SECTION
All toggles default to ON. Each controls visibility of one visual layer:
Show Market Structure: Pivot markers and support/resistance lines
Show Pressure Zones: Background color shading
Show Divergence Lines: Dotted lines connecting pivots
Show Institutional Footprint Markers: Absorption boxes, hunt labels, exhaustion labels
Show Consolidated Analysis Label: Main pattern detection label
Use Compact Label Format
Default: OFF
What It Does: Switches consolidated label between single-line compact format and multi-line detailed format.
When To Change: Turn ON if you find full labels too large or distracting.
Impact: Visual clarity vs. information density tradeoff.
DASHBOARD SECTION
Dashboard Mode
Default: "Optimized"
Options: Off, Compact, Optimized, Full
What It Does: Controls how much information the dashboard displays.
Off: No dashboard
Compact: 8 rows (essential metrics only)
Optimized: 12 rows (recommended balance)
Full: 13 rows (every available metric)
Dashboard Position
Default: "Top Right"
Options: Top Right, Top Left, Bottom Right, Bottom Left
What It Does: Screen corner where dashboard appears.
HOW TO USE VMDM - PRACTICAL WORKFLOW
STEP 1 - INITIAL SETUP
Add VMDM to your chart
Select your detection mode (Confirmed recommended for learning)
Set your minimum confluence score (start with 60-65)
Adjust pivot parameters if needed (default 3/3 is good for most timeframes)
Enable the visual layers you want to see
STEP 2 - CHART ANALYSIS
Let the indicator load and analyze historical data
Review the patterns that appear historically
Examine the confluence scores - notice which patterns had higher scores
Observe which patterns occurred during supportive pressure zones
Notice the divergence line connections - understand what price vs RSI did
STEP 3 - PATTERN RECOGNITION LEARNING
When a consolidated analysis label appears:
Read the divergence type (regular or hidden, bullish or bearish)
Check the quality tier (textbook, high quality, or valid)
Review the confluence breakdown - which factors contributed
Look at the chart context - where is price relative to structure, trend, etc.
Observe the behavioral footprint markers nearby - do they support the pattern
STEP 4 - REAL-TIME MONITORING
Watch the dashboard for real-time regime and pressure state
Monitor the current confluence score in the dashboard
When it approaches your threshold, be alert for potential pattern formation
When a new pattern appears (after confirmation delay), evaluate it using the workflow above
Use your trading strategy rules to decide if the setup aligns with your criteria
STEP 5 - POST-PATTERN OBSERVATION
After a pattern appears:
Mark the level on your chart
Observe what price does after the pattern completes
Did price respect the reversal/continuation signal
What was the confluence score of patterns that worked vs. those that failed
Learn which quality tiers and confluence levels produce better results on your specific symbol and timeframe
RECOMMENDED TIMEFRAMES AND ASSET CLASSES
VMDM is timeframe-agnostic and works on any asset with volume data. However, optimal performance varies:
BEST TIMEFRAMES
15-Minute to 1-Hour: Ideal balance of signal frequency and reliability. Pivot confirmation delay is acceptable. Sufficient volume data for pressure analysis.
4-Hour to Daily: Excellent for swing trading. Very high-quality signals. Lower frequency but higher significance. Recommended for learning because patterns are clearer.
1-Minute to 5-Minute: Works but requires adjustment. Increase pivot bars to 5-7 for filtering. Decrease max object history to 30 for performance. Expect more noise.
Weekly/Monthly: Works but very infrequent signals. Increase confluence threshold to 70+ to ensure only major patterns appear.
BEST ASSET CLASSES
Forex Majors: Excellent volume data and clear trends. Pressure analysis works well.
Crypto (Major Pairs): Good volume data. High volatility makes divergences more pronounced. Works very well.
Stock Indices (SPY, QQQ, etc.): Excellent. Clean price action and reliable volume.
Individual Stocks: Works well on high-volume stocks. Low-volume stocks may produce unreliable pressure readings.
Commodities (Gold, Oil, etc.): Works well. Clear trends and reactions.
WHAT THIS INDICATOR CANNOT DO - LIMITATIONS
LIMITATION 1 - It Does Not Predict The Future
VMDM identifies when technical conditions align historically associated with potential reversals or continuations. It does not predict what will happen next. A textbook 95-confluence pattern can still fail if fundamental events, news, or larger timeframe structure override the setup.
LIMITATION 2 - Confirmation Delay Means You Miss Early Entry
In Confirmed and Relaxed modes, the non-repainting design means you receive signals AFTER the pivot is confirmed. Price may have already moved significantly by the time you receive the signal. This is the tradeoff for non-repainting reliability. You can use Real-time mode for faster signals but sacrifice divergence confirmation.
LIMITATION 3 - It Does Not Tell You Position Sizing or Risk Management
VMDM provides technical pattern analysis. It does not calculate stop loss levels, take profit targets, or position sizing. You must apply your own risk management rules. Never risk more than you can afford to lose based on a technical signal.
LIMITATION 4 - Volume Pressure Analysis Requires Reliable Volume Data
On assets with thin volume or unreliable volume reporting, pressure analysis may be inaccurate. Stick to major liquid assets with consistent volume data.
LIMITATION 5 - It Cannot Detect Fundamental Events
VMDM is purely technical. It cannot predict earnings reports, central bank decisions, geopolitical events, or other fundamental catalysts that can override technical patterns.
LIMITATION 6 - Divergence Requires Two Pivots
The indicator cannot detect divergence until at least two pivots of the same type have formed. In strong trends without pullbacks, you may go long periods without signals.
LIMITATION 7 - Institutional Pattern Names Are Interpretive
The behavioral footprint patterns are named using common trading education terminology, but they are detected through technical analysis, not actual institutional data access. The patterns are interpretations based on price and volume behavior.
CONCEPT FOUNDATION - WHY THIS APPROACH WORKS
MARKET PRINCIPLE 1 - Momentum Divergence Precedes Price Reversal
Price is the final output of market forces, but momentum (the rate of change in those forces) shifts first. When price makes a new low but the momentum behind that move is weaker (higher RSI low), it signals that sellers are losing strength even though they temporarily pushed price lower. This precedes reversal. This is a fundamental principle in technical analysis taught by Charles Dow, widely observed in market behavior.
MARKET PRINCIPLE 2 - Volume Reveals Conviction
Price can move on low volume (low conviction) or high volume (high conviction). When price makes a new low on declining volume while RSI shows improving momentum, it suggests the new low is not confirmed by participant conviction. Adding volume pressure analysis to momentum divergence adds a confirmation layer that filters false divergences.
MARKET PRINCIPLE 3 - Anomalies Mark Structural Extremes
When volume spikes significantly but range contracts (absorption), or when price spikes beyond structure then reverses (stop hunt), or when aggressive moves are met with large-wick rejection (exhaustion), these anomalies often mark short-term extremes. Combining these structural observations with momentum analysis creates context.
MARKET PRINCIPLE 4 - Confluence Improves Probability
No single technical factor is reliable in isolation. RSI divergence alone fails frequently. Volume analysis alone cannot time entries. Combining multiple independent factors into a weighted system increases the probability that observed patterns have structural significance rather than random noise.
THE EDUCATIONAL VALUE
By visualizing all four layers simultaneously and breaking down the confluence scoring transparently, VMDM teaches you to think in terms of multi-dimensional analysis rather than single-indicator reliance. Over time, you will learn to recognize these patterns manually and understand which combinations produce better results on your traded assets.
INSTITUTIONAL TERMINOLOGY - IMPORTANT CLARIFICATION
This indicator uses the following terms that are common in trading education:
Institutional Footprint
Absorption (Accumulation / Distribution)
Stop Hunt
Exhaustion
CRITICAL DISCLAIMER:
These terms are EDUCATIONAL LABELS for specific price action and volume behavior patterns detected through technical analysis of publicly available chart data (open, high, low, close, volume). This indicator does NOT have access to:
Actual institutional order flow or order book data
Market maker positions or intentions
Broker stop-loss databases
Non-public trading data
Proprietary institutional information
The patterns labeled as "institutional footprint" are interpretations based on observable price and volume behavior that educational trading literature often associates with potential large-participant activity. The detection is algorithmic pattern recognition, not privileged data access.
When this indicator identifies "absorption," it means it detected high volume within a small range - a condition that MAY indicate large orders being filled but is not confirmation of actual institutional participation.
When it identifies a "stop hunt," it means price briefly penetrated a structural level then reversed - a pattern that MAY have triggered stop losses but is not confirmation that stops were specifically targeted.
When it identifies "exhaustion," it means high volume with large rejection wicks - a pattern that MAY indicate aggressive participation meeting strong opposition but is not confirmation of institutional involvement.
These are technical analysis interpretations, not factual statements about market participant identity or intent.
DISCLAIMER AND RISK WARNING
EDUCATIONAL PURPOSE ONLY
This indicator is designed as an educational tool to help traders learn to recognize technical patterns, understand multi-factor analysis, and practice systematic market observation. It is NOT a trading system, signal service, or financial advice.
NO PERFORMANCE GUARANTEE
Past pattern behavior does not guarantee future results. A pattern that historically preceded price movement in one direction may fail in the future due to changing market conditions, fundamental events, or random variance. Confluence scores reflect historical technical alignment, not future certainty.
TRADING INVOLVES SUBSTANTIAL RISK
Trading financial instruments involves substantial risk of loss. You can lose more than your initial investment. Never trade with money you cannot afford to lose. Always use proper risk management including stop losses, position sizing, and portfolio diversification.
NO PREDICTIVE CLAIMS
This indicator does NOT predict future price movement. It identifies when technical conditions align in patterns that historically have been associated with potential reversals or continuations. Market behavior is probabilistic, not deterministic.
BACKTESTING LIMITATIONS
If you backtest trading strategies using this indicator, ensure you account for:
Realistic commission costs
Realistic slippage (difference between signal price and actual fill price)
Sufficient sample size (minimum 100 trades for statistical relevance)
Reasonable position sizing (risking no more than 1-2 percent of account per trade)
The confirmation delay inherent in the indicator (you cannot enter at the exact pivot in Confirmed mode)
Backtests that do not account for these factors will produce unrealistic results.
AUTHOR LIABILITY
The author (BullByte) is not responsible for any trading losses incurred using this indicator. By using this indicator, you acknowledge that all trading decisions are your sole responsibility and that you understand the risks involved.
NOT FINANCIAL ADVICE
Nothing in this indicator, its code, its description, or its visual outputs constitutes financial, investment, or trading advice. Consult a licensed financial advisor before making investment decisions.
FREQUENTLY ASKED QUESTIONS
Q: Why do signals appear in the past, not at the current bar
A: In Confirmed and Relaxed modes, signals appear at confirmed pivots, which requires waiting for right-side confirmation bars (default 3). This creates a delay but prevents repainting. Use Real-time mode if you want current-bar signals without pivot confirmation.
Q: Can I use this for automated trading
A: You can create alert-based automation, but understand that Confirmed mode signals appear AFTER the pivot with delay, so your entry will not be at the pivot price. Real-time mode signals can change as the current bar develops. Automation requires careful consideration of these factors.
Q: How do I know which confluence score to use
A: Start with 60. Observe which patterns work on your symbol/timeframe. If too many false signals, increase to 70-75. If too few signals, decrease to 55. Quality vs. quantity tradeoff.
Q: Do regular divergences mean I should enter a reversal trade immediately
A: No. Regular divergences indicate momentum exhaustion, which is a WARNING sign that trend may reverse, not a confirmation that it will. Use confluence score, market context, support/resistance, and your strategy rules to make entry decisions. Many divergences fail.
Q: What's the difference between regular and hidden divergence
A: Regular divergence = price and momentum move in opposite directions at extremes = potential reversal signal. Hidden divergence = price and momentum move in opposite directions during pullbacks = potential continuation signal. Hidden divergence suggests the pullback is just a correction within the larger trend.
Q: Why does the pressure zone color sometimes conflict with the divergence direction
A: Pressure is real-time current bar analysis. Divergence is confirmed pivot analysis from the past. They measure different things at different times. A bullish divergence confirmed 3 bars ago might appear during current selling pressure. This is normal.
Q: Can I use this on stocks without volume data
A: No. Volume is required for pressure analysis and behavioral pattern detection. Use only on assets with reliable volume reporting.
Q: How often should I expect signals
A: Depends on timeframe and settings. Daily charts might produce 5-10 signals per month. 1-hour charts might produce 20-30. 15-minute charts might produce 50-100. Adjust confluence threshold to control frequency.
Q: Can I modify the code
A: Yes, this is open source. You can modify for personal use. If you publish a modified version, please credit the original and ensure your publication meets TradingView guidelines.
Q: What if I disagree with a pattern's confluence score
A: The scoring weights are based on general observations and may not suit your specific strategy or asset. You can modify the code to adjust weights if you have data-driven reasons to do so.
Final Notes
VMDM - Volume, Momentum and Divergence Master is an educational multi-layer market analysis system designed to teach systematic pattern recognition through transparent, confluence-weighted signal detection. By combining RSI momentum divergence, volume pressure quantification, behavioral footprint pattern recognition, and quality scoring into a unified framework, it provides a comprehensive learning environment for understanding market structure.
Use this tool to develop your analytical skills, understand how multiple technical factors interact, and learn to distinguish high-quality setups from noise. Remember that technical analysis is probabilistic, not predictive. No indicator replaces proper education, risk management, and trading discipline.
Trade responsibly. Learn continuously. Risk only what you can afford to lose.
-BullByte

EdgeFlow: Momentum RibbonThought for 11s
EdgeFlow: Momentum Ribbon Indicator
Overview
EdgeFlow: Momentum Ribbon is a versatile momentum-based trading indicator for TradingView, developed by @jay555b on X. This overlay tool combines a simple EMA ribbon for trend identification with a selectable oscillator (Stochastic RSI or Regular Stochastic) for detecting overbought/oversold conditions, all enhanced by higher timeframe (HTF) logic and price confirmation for robust entry signals. It's designed to help traders spot potential momentum shifts and trend continuations in various markets and timeframes, such as stocks, forex, or cryptocurrencies.
The "meshup" (mashup) of components—EMA crossovers, oscillator extremes, HTF filtering, and strict price-based confirmation—creates a multi-layered system that reduces false signals common in single-indicator strategies. EMAs provide the core trend bias, the oscillator adds momentum sensitivity, HTF ensures alignment with broader market structure, and the price close condition (e.g., closing above previous high for longs) acts as a final filter for conviction. This integration aims to capture "edge flows" where momentum aligns with trend, making it suitable for swing trading, scalping on lower timeframes, or confirming entries in trend-following systems. Note: This is a technical tool for educational purposes only; it does not provide financial advice, guarantees of profitability, or trading recommendations. Past performance is not indicative of future results, and users should backtest and use at their own risk, in compliance with TradingView's house rules.
Key Features
• EMA Ribbon: A visual band between fast (9-period) and slow (21-period) EMAs, filled green for bullish trends (fast > slow) or red for bearish, offering an at-a-glance trend overview.
• Selectable Oscillator: Choose between Stochastic RSI (for RSI-smoothed momentum) or Regular Stochastic (matching TradingView's default formula), with customizable lengths and smoothing.
• Setup and Confirmation Signals: Plots tiny squares for "setups" (oscillator crosses at extremes aligned with EMA trend) and triangles with "L"/"S" labels for confirmed entries (setup + HTF close + price break).
• Higher Timeframe (HTF) Integration: Processes logic on a user-defined HTF (or chart TF if blank), with a "max opposite-stack bars" tolerance to allow minor counter-trend bars before disarming signals.
• Persistent Arming Logic: Setups "arm" the system, persisting until confirmed or invalidated, preventing rapid flipping in choppy markets.
• Alerts: Built-in conditions for bullish/bearish setups and confirmations, with clean messages for easy integration into TradingView alerts.
How It Works
• EMA Trend Logic: The fast EMA (default 9) is compared to the slow EMA (default 21) to determine bullish (fast > slow) or bearish trends. This forms the ribbon's color and biases all signals—bullish setups require a bullish EMA, and vice versa.
• Oscillator Calculation:
o Stochastic RSI: Computes RSI (default 14 on close), then applies Stochastic (default length 8, %K smoothing 3, %D smoothing 3) to it, creating a bounded oscillator sensitive to relative strength momentum.
o Regular Stochastic: Uses high/low/close sources (defaults unchanged for accuracy), with %K length (8), %K smoothing (3), and %D smoothing (3), exactly matching TradingView's built-in Stochastic for consistency.
o Shared levels: Overbought (80) for bearish setups (crossover above), Oversold (20) for bullish setups (crossunder below).
• Setup Conditions: A bullish setup occurs on an oversold crossunder during a bullish EMA trend; bearish on overbought crossover during bearish EMA. These arm the system persistently.
• Confirmation Logic: On HTF bar close, confirm if armed, trend-aligned, within max opposite bars (default 0 for strictness), and price confirms (close > previous high for long, close < previous low for short). This meshup filters noise: EMAs ensure trend context, oscillator spots extremes, HTF adds multi-TF confluence, and price break demands immediate strength.
• Projection and Plotting: Signals project onto the chart's TF from HTF, plotting only on new HTF bars for clarity. Ribbon fill uses semi-transparent green/red based on trend.
• Why This Meshup?: Isolated indicators often fail in ranging or volatile markets—e.g., EMAs lag, oscillators whipsaw. By meshing them:
o EMAs provide directional bias to avoid counter-trend trades.
o Oscillator adds timing at extremes, catching pullbacks in trends.
o HTF reduces lower-TF noise, ensuring signals align with bigger-picture structure.
o Price confirmation (close beyond prior bar's extreme) adds a candlestick-like filter for momentum conviction, mimicking breakout strategies. This creates a "flow" of edges: trend + momentum + structure + price action, potentially improving signal quality over standalone tools. It's inspired by classic momentum strategies but customized for modern volatility.
All calculations use request.security for HTF data with lookahead off, ensuring real-time accuracy without repainting.
Settings and Customization
Inputs are grouped for ease:
1. EMA Settings:
o Fast EMA Length: Period for fast EMA (default: 9).
o Slow EMA Length: Period for slow EMA (default: 21).
2. Oscillator Selection:
o Oscillator Type: "Stochastic RSI" (default) or "Regular Stochastic".
3. Stochastic RSI Settings (active when selected):
o RSI Source: Input source (default: close).
o RSI Length: RSI period (default: 14).
o Stoch RSI Length: Stochastic length on RSI (default: 8).
o %K Smoothing: Smoothing for %K (default: 3).
o %D Smoothing: Smoothing for %D (default: 3).
4. Regular Stochastic Settings (active when selected):
o High/Low/Close Sources: Defaults to high/low/close (do not change for accuracy, as per tooltip).
o %K Length: Period for Stochastic (default: 8, min 1).
o %K Smoothing: Smoothing for %K (default: 3, min 1).
o %D Smoothing: Smoothing for %D (default: 3, min 1).
5. Shared Oscillator Settings:
o Overbought Level: Threshold for bearish setups (default: 80).
o Oversold Level: Threshold for bullish setups (default: 20).
6. HTF Settings:
o Higher Timeframe: Blank uses chart TF; otherwise, specify (e.g., "1D").
o Max Opposite-Stack Bars: Tolerance for counter-trend bars while armed (default: 0; higher allows more flexibility).
No additional plots or tables; all visuals are shapes and fills for minimal chart clutter.
Usage Tips
• Trend Trading: Use the ribbon color as your primary filter—enter longs only in green, shorts in red. Confirmed triangles ("L"/"S") signal entries; setups (squares) as early warnings.
• Timeframe Strategy: Set HTF to 1-2 levels higher (e.g., 15m chart with 1H HTF) for confluence. Increase max opposite bars in trending markets to catch pullbacks.
• Oscillator Choice: Stochastic RSI for smoother, RSI-biased signals in volatile assets; Regular Stochastic for price-based purity in ranging markets.
• Alert Integration: Set up TradingView alerts for setups (potential watches) and confirmations (entries). Messages are concise for notifications.
• Combination Ideas: Pair with volume indicators or support/resistance for exits. Backtest on your asset/timeframe to optimize lengths.
• Chart Compatibility: Works on any chart type; signals plot small to avoid obstruction.
Limitations
• Reactive Nature: Signals confirm after HTF close and price break, so they may lag in fast markets. Not ideal for ultra-short scalps.
• False Signals in Ranges: Like all trend-momentum tools, performs best in trending conditions; chop can produce disarmed setups without confirmations.
• No Repainting: Uses lookahead off, but HTF projection means signals appear on new bars—test live.
• Customization Risks: Changing source inputs (e.g., in Regular Stochastic) may break accuracy; stick to tooltips.
• Disclaimer: This indicator is for informational use only. Trading involves risk; consult professionals. Abiding by TradingView rules, no claims of profitability are made—results vary by market conditions and user strategy.

Volume Intelligence Pro [Abusuhil]═══════════════════════════════════════════════════════════════════════════════
📊 VOLUME INTELLIGENCE TABLE - PROFESSIONAL VOLUME ANALYSIS INDICATOR
═══════════════════════════════════════════════════════════════════════════════
🌐 BILINGUAL SUPPORT: Full support for English and Arabic languages - switch instantly from settings!
🎯 COMPREHENSIVE VOLUME ANALYSIS DASHBOARD
This advanced indicator provides institutional-grade volume analysis through an elegant, customizable table that displays critical volume metrics in real-time. Designed for professional traders who need deep insights into market volume dynamics, order flow, and smart money movements.
═══════════════════════════════════════════════════════════════════════════════
✨ KEY FEATURES
═══════════════════════════════════════════════════════════════════════════════
🔷 BILINGUAL INTERFACE
• Seamless switching between English and Arabic
• All metrics, labels, and signals fully translated
• Perfect for international traders
🔷 VOLUME FUNDAMENTALS
• Current Volume: Real-time volume tracking
• Volume SMA: Moving average for volume comparison
• Volume Ratio: Current volume vs average (identifies abnormal activity)
• Volume % Change: Percentage change from previous bar
• Volume Delta: Difference between buying and selling pressure
🔷 VOLUME SPIKE DETECTION (4 LEVELS)
• Weak Spike: 1.5x average volume
• Medium Spike: 2.0x average volume
• Strong Spike: 2.5x average volume
• Extreme Spike: 3.0x+ average volume
• Visual alerts with color-coded indicators
🔷 ADVANCED BUY/SELL PRESSURE ANALYSIS
• Buy Volume: Bullish candle volume accumulation
• Sell Volume: Bearish candle volume accumulation
• Buy Pressure %: Percentage of buying pressure
• Sell Pressure %: Percentage of selling pressure
• Pressure Dominance: Who controls the market (Buyers/Sellers/Neutral)
• Candle Body Strength: Measures conviction in price movement
• Imbalance Volume: Detects wick imbalances
• Volume Delta (HLC3): Advanced delta calculation
• Weighted Delta: Volume-weighted price movement
• Pressure Lookback: Multi-candle pressure analysis (optimized for performance)
🔷 TECHNICAL INDICATORS INTEGRATION
• VWMA (Volume Weighted Moving Average): Price vs VWMA positioning
• OBV (On Balance Volume): Trend detection with EMA smoothing
• OBV Divergence: Bullish/Bearish divergence detection
• MFI (Money Flow Index): Overbought/oversold conditions
• A/D Line (Accumulation/Distribution): Smart money tracking
🔷 AI-POWERED VOLUME INTELLIGENCE SCORING
• Entry Power: Measures volume strength combined with price movement
• Effort vs Result: Identifies climax situations (buying/selling exhaustion)
• Reversal Volume Analysis: Tracks volume at reversal candles
• Trend Integration: Combines trend direction with volume confirmation
• Bullish/Bearish Points: 11-point scoring system
• Volume Score: -100 to +100 scale (positive = bullish, negative = bearish)
• Confidence Level: Reliability percentage of the signal
• Final Signal: Clear BULLISH/BEARISH/NEUTRAL verdict
🔷 TRIPLE SIGNAL SYSTEM (Optional)
• Signal 1: Volume Score Based (customizable thresholds)
• Signal 2: Volume Spike + Candle Color (spike level selection)
• Signal 3: OBV Divergence Detection
• Independent on/off toggles for each signal
• Visual signals plotted on chart with triangles
• Combined signal alerts
🔷 COMPREHENSIVE ALERT SYSTEM
• Volume spike alerts (configurable levels)
• Signal 1, 2, 3 individual alerts
• Combined buy/sell signal alerts
• OBV trend change alerts
• Strong buying/selling pressure alerts
• Customizable alert frequency
═══════════════════════════════════════════════════════════════════════════════
📊 TABLE STRUCTURE & DISPLAY
═══════════════════════════════════════════════════════════════════════════════
The indicator features a professional 3-column table with the following sections:
📌 COLUMN HEADERS:
• INDICATOR: Metric name
• VALUE: Current reading
• STATUS: Visual status indicator (color-coded dots/icons)
📌 SECTION 1: VOLUME BASICS
Displays fundamental volume metrics with ratio indicators and percentage changes. Essential for understanding current market activity levels.
📌 SECTION 2: VOLUME SPIKE DETECTION
Real-time spike detection with 4 severity levels. Color-coded for instant recognition of abnormal volume.
📌 SECTION 3: BUY/SELL PRESSURE (ADVANCED)
Comprehensive order flow analysis with 10+ metrics. Includes advanced calculations like weighted delta, imbalance volume, and multi-candle pressure lookback.
📌 SECTION 4: VWMA ANALYSIS
Shows price position relative to volume-weighted moving average. Critical for identifying volume-supported moves.
📌 SECTION 5: OBV ANALYSIS
On Balance Volume trend and divergence detection. Helps identify smart money accumulation/distribution.
📌 SECTION 6: MFI ANALYSIS
Money Flow Index readings with overbought/oversold signals. Combines price and volume for comprehensive analysis.
📌 SECTION 7: A/D LINE
Accumulation/Distribution line trend analysis. Tracks institutional buying and selling.
📌 SECTION 8: VOLUME INTELLIGENCE
AI-powered scoring system with 11 evaluation points:
1. Volume strength assessment
2. Current buy/sell pressure
3. Multi-candle pressure lookback
4. Entry power calculation
5. Reversal volume tracking
6. VWMA position
7. OBV trend
8. OBV divergence
9. MFI signal
10. A/D trend
11. Trend-volume integration
Final output: Volume Score, Confidence Level, and highlighted FINAL SIGNAL.
═══════════════════════════════════════════════════════════════════════════════
⚙️ CUSTOMIZATION OPTIONS
═══════════════════════════════════════════════════════════════════════════════
🎨 TABLE DISPLAY
• Position: 9 locations (top-left, top-center, top-right, middle-left, etc.)
• Size: 5 sizes (tiny, small, normal, large, huge)
• Colors: Fully customizable background and text colors
• Sections: Show/hide any section independently
🎯 VOLUME SETTINGS
• Volume Average Length (default: 20)
• Spike Thresholds: Adjustable multipliers for each level
• Advanced Metrics: Lookback periods (optimized: 10 candles)
• Reversal Analysis: Candle count (optimized: 5 candles)
📊 INDICATOR LENGTHS
• OBV Smoothing: Default 14
• MFI Period: Default 14
• VWMA Length: Default 20
• A/D Length: Default 14
🎯 SIGNAL SYSTEM
• Enable/disable each signal independently
• Customizable thresholds for Signal 1 (score & confidence)
• Spike level selection for Signal 2
• Show/hide signals on chart
• Alert configuration for each signal type
═══════════════════════════════════════════════════════════════════════════════
🚀 PERFORMANCE & OPTIMIZATION
═══════════════════════════════════════════════════════════════════════════════
✅ REPLAY MODE OPTIMIZED
• Works flawlessly in TradingView Replay mode
• Optimized calculations for fast historical analysis
• No lag or freezing issues
✅ REAL-TIME EFFICIENCY
• Lightweight code structure (50 labels/lines limit)
• Smart caching of repeated calculations
• Limited loop iterations for optimal performance
• Updates only on last bar (table rendering)
✅ NON-REPAINTING
• All signals are confirmed on bar close
• No retrospective changes to historical signals
• Reliable for backtesting and strategy development
═══════════════════════════════════════════════════════════════════════════════
💡 USAGE RECOMMENDATIONS
═══════════════════════════════════════════════════════════════════════════════
📈 FOR DAY TRADING:
• Use 15m-1H timeframes
• Enable all sections for comprehensive analysis
• Focus on Volume Spike and Buy/Sell Pressure sections
• Set alerts for Strong and Extreme spikes
📈 FOR SWING TRADING:
• Use 4H-1D timeframes
• Focus on Volume Intelligence and OBV sections
• Enable Signal 1 and Signal 3 for swing entries
• Monitor divergences for trend reversals
📈 FOR SCALPING:
• Use 1m-5m timeframes
• Focus on Buy/Sell Pressure and Volume Basics
• Enable Signal 2 for quick spike-based entries
• Hide less relevant sections to reduce visual clutter
═══════════════════════════════════════════════════════════════════════════════
🎓 INDICATOR METHODOLOGY
═══════════════════════════════════════════════════════════════════════════════
This indicator combines classical volume analysis with modern algorithmic intelligence:
1. Volume Profiling: Identifies abnormal volume relative to historical averages
2. Order Flow Analysis: Separates buying and selling pressure using candle structure
3. Divergence Detection: Compares price action with volume indicators
4. Multi-Timeframe Approach: Uses smoothing and lookback for context
5. Scoring Algorithm: 11-point evaluation system for objective signal generation
6. Confluence Integration: Combines multiple indicators for higher probability setups
═══════════════════════════════════════════════════════════════════════════════
⚠️ DISCLAIMER
═══════════════════════════════════════════════════════════════════════════════
This indicator is a tool for analysis and should not be used as the sole basis for trading decisions. Always combine with your own analysis, risk management, and trading plan. Past performance does not guarantee future results.
═══════════════════════════════════════════════════════════════════════════════
📞 SUPPORT & UPDATES
═══════════════════════════════════════════════════════════════════════════════
• Regular updates and improvements
• Bug fixes and optimization
• Feature requests considered
• Community feedback welcomed
═══════════════════════════════════════════════════════════════════════════════
🌟 Happy Trading! May your volume analysis lead to profitable decisions! 🚀
═══════════════════════════════════════════════════════════════════════════════
═══════════════════════════════════════════════════════════════════════════════
═══════════════════════════════════════════════════════════════════════════════
📊 جدول معلومات الفوليوم - مؤشر احترافي لتحليل حجم التداول
═══════════════════════════════════════════════════════════════════════════════
🌐 دعم ثنائي اللغة: دعم كامل للغتين الإنجليزية والعربية - التبديل الفوري من الإعدادات!
🎯 لوحة معلومات شاملة لتحليل الفوليوم
مؤشر متقدم يوفر تحليلاً احترافياً للفوليوم من خلال جدول أنيق وقابل للتخصيص يعرض مقاييس الفوليوم الحيوية في الوقت الفعلي. مصمم للمتداولين المحترفين الذين يحتاجون إلى رؤى عميقة حول ديناميكيات حجم السوق، تدفق الأوامر، وحركة الأموال الذكية.
═══════════════════════════════════════════════════════════════════════════════
✨ الميزات الرئيسية
═══════════════════════════════════════════════════════════════════════════════
🔷 واجهة ثنائية اللغة
• التبديل السلس بين الإنجليزية والعربية
• جميع المقاييس والتسميات والإشارات مترجمة بالكامل
• مثالي للمتداولين العرب والدوليين
🔷 أساسيات الفوليوم
• الفوليوم الحالي: تتبع حجم التداول في الوقت الفعلي
• متوسط الفوليوم: المتوسط المتحرك للمقارنة
• نسبة الفوليوم: الحجم الحالي مقابل المتوسط (يحدد النشاط غير الطبيعي)
• تغير الفوليوم %: نسبة التغيير من الشمعة السابقة
• دلتا الفوليوم: الفرق بين ضغط الشراء والبيع
🔷 اكتشاف انفجارات الفوليوم (4 مستويات)
• انفجار ضعيف: 1.5 ضعف المتوسط
• انفجار متوسط: 2.0 ضعف المتوسط
• انفجار قوي: 2.5 ضعف المتوسط
• انفجار شديد: 3.0+ ضعف المتوسط
• تنبيهات بصرية مع مؤشرات ملونة
🔷 تحليل متقدم لضغط الشراء/البيع
• حجم الشراء: تراكم حجم الشموع الصاعدة
• حجم البيع: تراكم حجم الشموع الهابطة
• ضغط الشراء %: نسبة ضغط الشراء
• ضغط البيع %: نسبة ضغط البيع
• سيطرة الضغط: من يتحكم في السوق (المشترين/البائعين/محايد)
• قوة جسم الشمعة: يقيس قوة حركة السعر
• عدم التوازن: يكتشف اختلال توازن الفتائل
• دلتا الفوليوم (HLC3): حساب متقدم للدلتا
• الدلتا المرجح: حركة السعر المرجحة بالحجم
• تحليل الضغط متعدد الشموع: تحليل عدة شموع (محسّن للأداء)
🔷 تكامل المؤشرات الفنية
• VWMA (المتوسط المرجح بالحجم): موقع السعر مقابل VWMA
• OBV (الحجم التراكمي): اكتشاف الاتجاه مع تمهيد EMA
• تباعد OBV: كشف التباعدات الصعودية/الهبوطية
• MFI (مؤشر تدفق الأموال): حالات التشبع الشرائي/البيعي
• خط A/D (التراكم/التوزيع): تتبع الأموال الذكية
🔷 نظام تقييم ذكي مدعوم بالذكاء الاصطناعي
• قوة الدخول: يقيس قوة الفوليوم مع حركة السعر
• الجهد مقابل النتيجة: يحدد حالات الذروة (استنزاف الشراء/البيع)
• تحليل حجم الانعكاس: يتتبع الحجم عند شموع الانعكاس
• تكامل الاتجاه: يجمع اتجاه الترند مع تأكيد الفوليوم
• النقاط الصعودية/الهبوطية: نظام تقييم من 11 نقطة
• تقييم الفوليوم: مقياس من -100 إلى +100 (موجب = صعودي، سالب = هبوطي)
• مستوى الثقة: نسبة موثوقية الإشارة
• الإشارة النهائية: حكم واضح (صعودي/هبوطي/محايد)
🔷 نظام الإشارات الثلاثي (اختياري)
• الإشارة 1: بناءً على تقييم الفوليوم (عتبات قابلة للتخصيص)
• الإشارة 2: انفجار الفوليوم + لون الشمعة (اختيار مستوى الانفجار)
• الإشارة 3: كشف تباعد OBV
• تفعيل/إلغاء مستقل لكل إشارة
• إشارات بصرية على الشارت بمثلثات
• تنبيهات إشارات مجمعة
🔷 نظام تنبيهات شامل
• تنبيهات انفجار الفوليوم (مستويات قابلة للتهيئة)
• تنبيهات فردية للإشارات 1، 2، 3
• تنبيهات إشارات الشراء/البيع المجمعة
• تنبيهات تغيير اتجاه OBV
• تنبيهات ضغط الشراء/البيع القوي
• تردد التنبيهات قابل للتخصيص
═══════════════════════════════════════════════════════════════════════════════
📊 بنية الجدول والعرض
═══════════════════════════════════════════════════════════════════════════════
يتميز المؤشر بجدول احترافي من 3 أعمدة مع الأقسام التالية:
📌 عناوين الأعمدة:
• المؤشر: اسم المقياس
• القيمة: القراءة الحالية
• الحالة: مؤشر الحالة البصري (نقاط/رموز ملونة)
📌 القسم 1: أساسيات الفوليوم
يعرض مقاييس الفوليوم الأساسية مع مؤشرات النسب والتغيرات المئوية. ضروري لفهم مستويات نشاط السوق الحالي.
📌 القسم 2: كشف انفجارات الفوليوم
كشف فوري للانفجارات مع 4 مستويات من الشدة. ملون للتعرف الفوري على الحجم غير الطبيعي.
📌 القسم 3: ضغط الشراء/البيع (متقدم)
تحليل شامل لتدفق الأوامر مع أكثر من 10 مقاييس. يتضمن حسابات متقدمة مثل الدلتا المرجح، حجم عدم التوازن، وتحليل الضغط متعدد الشموع.
📌 القسم 4: تحليل VWMA
يعرض موقع السعر بالنسبة للمتوسط المرجح بالحجم. حاسم لتحديد الحركات المدعومة بالحجم.
📌 القسم 5: تحليل OBV
اتجاه الحجم التراكمي وكشف التباعدات. يساعد في تحديد تراكم/توزيع الأموال الذكية.
📌 القسم 6: تحليل MFI
قراءات مؤشر تدفق الأموال مع إشارات التشبع. يجمع بين السعر والحجم للتحليل الشامل.
📌 القسم 7: خط A/D
تحليل اتجاه خط التراكم/التوزيع. يتتبع الشراء والبيع المؤسسي.
📌 القسم 8: الذكاء الاصطناعي للفوليوم
نظام تقييم ذكي مع 11 نقطة تقييم:
1. تقييم قوة الفوليوم
2. ضغط الشراء/البيع الحالي
3. تحليل الضغط متعدد الشموع
4. حساب قوة الدخول
5. تتبع حجم الانعكاس
6. موقع VWMA
7. اتجاه OBV
8. تباعد OBV
9. إشارة MFI
10. اتجاه A/D
11. تكامل الاتجاه مع الفوليوم
الناتج النهائي: تقييم الفوليوم، مستوى الثقة، والإشارة النهائية المميزة.
═══════════════════════════════════════════════════════════════════════════════
⚙️ خيارات التخصيص
═══════════════════════════════════════════════════════════════════════════════
🎨 عرض الجدول
• الموقع: 9 مواقع (أعلى-يسار، أعلى-وسط، أعلى-يمين، وسط-يسار، إلخ)
• الحجم: 5 أحجام (صغير جداً، صغير، عادي، كبير، ضخم)
• الألوان: خلفية ونص قابل للتخصيص بالكامل
• الأقسام: إظهار/إخفاء أي قسم بشكل مستقل
🎯 إعدادات الفوليوم
• طول متوسط الفوليوم (افتراضي: 20)
• عتبات الانفجار: مضاعفات قابلة للتعديل لكل مستوى
• مقاييس متقدمة: فترات التحليل (محسّن: 10 شموع)
• تحليل الانعكاس: عدد الشموع (محسّن: 5 شموع)
📊 أطوال المؤشرات
• تمهيد OBV: افتراضي 14
• فترة MFI: افتراضي 14
• طول VWMA: افتراضي 20
• طول A/D: افتراضي 14
🎯 نظام الإشارات
• تفعيل/إلغاء كل إشارة بشكل مستقل
• عتبات قابلة للتخصيص للإشارة 1 (التقييم والثقة)
• اختيار مستوى الانفجار للإشارة 2
• إظهار/إخفاء الإشارات على الشارت
• تهيئة التنبيهات لكل نوع إشارة
═══════════════════════════════════════════════════════════════════════════════
🚀 الأداء والتحسين
═══════════════════════════════════════════════════════════════════════════════
✅ محسّن لوضع الريبلاي
• يعمل بسلاسة في وضع Replay في TradingView
• حسابات محسّنة للتحليل التاريخي السريع
• لا توجد مشاكل تأخير أو تجميد
✅ كفاءة الوقت الفعلي
• بنية كود خفيفة (حد 50 علامة/خط)
• تخزين ذكي للحسابات المتكررة
• تكرارات محدودة للحلقات للأداء الأمثل
• تحديثات فقط على آخر شمعة (عرض الجدول)
✅ غير قابل لإعادة الرسم
• جميع الإشارات مؤكدة عند إغلاق الشمعة
• لا توجد تغييرات بأثر رجعي على الإشارات التاريخية
• موثوق للاختبار الخلفي وتطوير الاستراتيجيات
═══════════════════════════════════════════════════════════════════════════════
💡 توصيات الاستخدام
═══════════════════════════════════════════════════════════════════════════════
📈 للتداول اليومي:
• استخدم فريمات 15د-1س
• فعّل جميع الأقسام للتحليل الشامل
• ركز على أقسام انفجار الفوليوم وضغط الشراء/البيع
• ضع تنبيهات للانفجارات القوية والشديدة
📈 للتداول المتأرجح:
• استخدم فريمات 4س-1ي
• ركز على أقسام الذكاء الاصطناعي و OBV
• فعّل الإشارة 1 والإشارة 3 لدخولات التأرجح
• راقب التباعدات لانعكاسات الاتجاه
📈 للمضاربة:
• استخدم فريمات 1د-5د
• ركز على ضغط الشراء/البيع وأساسيات الفوليوم
• فعّل الإشارة 2 لدخولات سريعة بناءً على الانفجارات
• أخفِ الأقسام الأقل صلة لتقليل الفوضى البصرية
═══════════════════════════════════════════════════════════════════════════════
🎓 منهجية المؤشر
═══════════════════════════════════════════════════════════════════════════════
يجمع هذا المؤشر بين تحليل الفوليوم الكلاسيكي والذكاء الخوارزمي الحديث:
1. تحديد الفوليوم: يحدد الحجم غير الطبيعي نسبة للمتوسطات التاريخية
2. تحليل تدفق الأوامر: يفصل ضغط الشراء والبيع باستخدام بنية الشمعة
3. كشف التباعد: يقارن حركة السعر مع مؤشرات الفوليوم
4. نهج متعدد الفريمات: يستخدم التمهيد والتحليل الرجعي للسياق
5. خوارزمية التقييم: نظام تقييم من 11 نقطة لتوليد إشارات موضوعية
6. تكامل التقاء: يجمع عدة مؤشرات لإعدادات ذات احتمالية أعلى
═══════════════════════════════════════════════════════════════════════════════
⚠️ إخلاء المسؤولية
═══════════════════════════════════════════════════════════════════════════════
هذا المؤشر هو أداة للتحليل ولا ينبغي استخدامه كأساس وحيد لقرارات التداول. اجمع دائماً مع تحليلك الخاص وإدارة المخاطر وخطة التداول. الأداء السابق لا يضمن النتائج المستقبلية.
═══════════════════════════════════════════════════════════════════════════════
📞 الدعم والتحديثات
═══════════════════════════════════════════════════════════════════════════════
• تحديثات وتحسينات منتظمة
• إصلاحات الأخطاء والتحسين
• طلبات الميزات قيد الاعتبار
• ملاحظات المجتمع مرحب بها
═══════════════════════════════════════════════════════════════════════════════
🌟 تداول سعيد! نتمنى أن يقودك تحليل الفوليوم إلى قرارات مربحة! 🚀
═══════════════════════════════════════════════════════════════════════════════
═══════════════════════════════════════════════════════════════════════════════
